
AI Search and Brand Visibility: Measuring Share of Model



UIC University 365 Institute of Communication
Series Marketing
Duration 25 minutes
Digital Communication, Marketing, Branding, Content Strategy, Media Studies

UNOP Sound (University 365 Neuroscience Oriented Pedagogy)
Take five minutes to prepare your brain. Play the isochronous tone track (40Hz gamma frequency) with your eyes closed. Gamma-frequency tones before a learning session raise attention and make the material easier to absorb.
[Audio player: UNOP Pre-Lecture Isochrone (40Hz, 5 minutes)]
In this Lecture


AI Search and Brand Visibility: Measuring Share of Model
Two Dashboards, Eleven Points Apart
The meeting had one agenda item and it lasted forty minutes. A brand team had bought two AI visibility dashboards. Both tracked the same product category, both covered the same month, and both reported a "share of model" number for the same brand. One said 31 percent. The other said 20 percent. Nobody in the room could say which number belonged in the board pack, and the vendor on each call had a defensible explanation for the gap.
The explanations were all true. The prompt sets were different. One tool asked 25 questions, the other asked 180. One sampled each question once a week, the other sampled three times a day. One counted a brand as present if the model named it anywhere in the answer, the other required a recommendation. One reported a share of all brand mentions in the answer, the other reported a share of answers that contained the brand. Those are four different measurements wearing the same label, and any two of them will disagree.
This lecture is about the measurement, not the tactics. Tactics for earning the answer belong to the companion lecture in this series, Generative Engine Optimization: Winning the AI Answer. What follows is the part that decides whether your number survives a review: what share of model actually divides, how many answers you need before a frequency means anything, how to build a prompt set you can defend a year later, how to score a single answer the same way twice, and what a one-page scorecard for one brand looks like when it is filled in with real arithmetic.
The outcome you should have at the end is one page. Nine lines, a sample size, a prompt-set version, the model versions you tested, and a margin that tells the reader how much of a move is noise. Everything else in this lecture serves that page.
A note on dates. Every external figure was checked on 16 November 2026 and carries its own date: Pew Research Center on March 2025 behaviour, published in July 2025; Google announcements of 3 June 2026, rolled out worldwide by 31 August 2026; the KDD 2024 measurement study by Aggarwal and colleagues. The worked scorecard is my own arithmetic, labelled as an example rather than a measurement of any real brand.

What Share of Model Measures
Share of model is a frequency with a ratio on top. You take a fixed set of questions, put each one to several AI engines, count how often your brand is named, and divide by all the brand names that appeared in the same answers. Multiply by 100 and you have a percentage.
The formula is short enough to write on one line:
Share of model = (mentions of your brand / mentions of all brands in the category) x 100
The term is usually credited to Jack Smyth at Jellyfish, and it was in the advertising trade press by 2024. The definition matters more than the credit. Notice what the denominator contains: every brand named in those answers, not every answer. That single choice is why two tools can report numbers eleven points apart and both be arithmetically correct.
Three neighbouring metrics get confused with it, and the confusion is expensive because each one answers a different question.
Metric | What it divides | What it answers | How stable it is |
Share of voice | your paid and earned presence by all presence in the category | how loud you are | stable, and buyable |
Share of search | searches for your brand by searches for the category | how much demand already knows you | stable, and slow |
Share of model | your mentions by all brand mentions in the answers | whether the engine names you when a buyer asks | volatile, and earned |
Citation share | answers linking to a domain you control by answers checked | whether the engine treats you as a source | volatile, and earned |
Mention rate | answers naming you by answers checked | how often you appear at all | volatile, and earned |
Share of model cannot be bought with media budget the way share of voice can. You influence it through what the wider web says about you, because that is what retrieval systems read and what training data contains. The number therefore moves when the model changes, when an engine changes its retrieval policy, or when a competitor publishes a comparison page. A metric that moves for reasons outside your control needs a stated margin before anyone reads a trend into it.
One more definitional trap. Share of model is not a ranking. There is no position one that stays in place long enough to defend. These systems generate text by sampling, so the same prompt can return a different list on a second run, and the order within an answer carries less information than the fact of being included. The correct unit is the frequency across many runs, never the order in a single run.

AI Search and Brand Visibility: Measuring Share of Model
Three Numbers, Three Denominators
Before you build any dashboard, separate three quantities that share the same raw data and answer different questions. Doing this on paper takes ten minutes and prevents most of the arguments that follow.
Mention rate. The share of answers in which your brand appears at all. Denominator: answers checked. If you ran 1,200 answers and your brand appeared in 252 of them, your mention rate is 21.0 percent.
Share of model. Your mentions divided by all brand mentions in those same answers. If your category is crowded and the engines name 2.4 brands per answer on average, those 1,200 answers contain about 2,880 brand mentions. Your 252 mentions are 8.75 percent of them. That is your share of model, and it is less than half your mention rate, because you are one of several names in most answers.
Citation share. The share of answers that link to a domain you control. Denominator: answers checked. If 78 of your 1,200 answers carried a link to your site, your citation share is 6.5 percent. This is the line that predicts whether an answer can send anyone to you, and it is usually far below the mention rate.
Two optional lines make the picture usable. Recommendation rate counts only answers naming you in the first three options: 132 of 1,200 is 11.0 percent. Answer accuracy counts the mentions that describe what you do correctly: 229 of 252 is 90.9 percent, and the other 9.1 percent is a content defect that no optimization fixes.
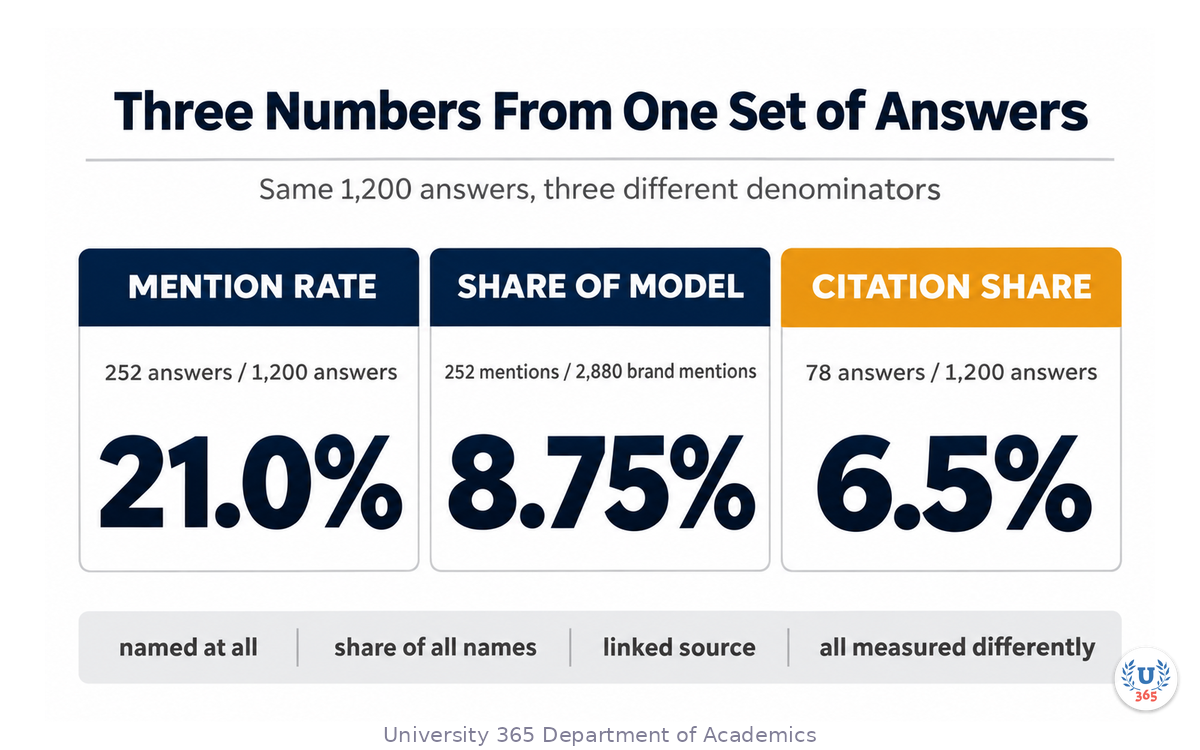
The reason to keep all of them is diagnostic. A brand with a 21 percent mention rate and a 6.5 percent citation share is being named without being sourced, which means the engine knows the name but not the evidence. A brand with a 6.5 percent mention rate and a 6.0 percent citation share appears less often but nearly always as a source, which is a different position and a different next move. A single blended number hides both.
Write the three definitions into the header of the scorecard before you collect a single answer. If two people cannot agree on the denominator, they will not agree on the number.

AI Search and Brand Visibility: Measuring Share of Model
Why Every Engine Tells a Different Story
An AI answer is produced by at least three machines, and only one is the model: a retrieval layer that decides which pages to read, a ranking layer inside that retrieval, and the model that composes the answer. Two engines using the same model can produce different answers because they read different pages, and that difference is structural rather than a bug to be averaged away.
Engines that ground their answers in fetched pages can only cite what their crawler reached and stored. If your documentation sits behind a JavaScript shell, if your robots rules exclude the crawler, or if your prices live only inside a PDF, that engine has nothing to quote. Chat assistants answering without retrieval work from training data plus whatever the conversation contains, so they reflect what the web said months ago rather than this morning.
Three further variables change the answer for reasons unrelated to your content. Locale: a prompt asked in German from a German address retrieves German sources. Personalisation: a signed-in user with a history of asking about one vendor gets a different answer from a fresh session. Catalogue churn: model versions are replaced on the vendor's schedule, and a version change can move a frequency with no change on your side.
In the worked example used throughout this lecture, one brand holds 27.0 percent on the first engine, 24.0 percent on the second, 19.0 percent on the third and 14.0 percent on the fourth. Blended, that is 21.0 percent. The blended number is the one a board will ask for, and it is the least actionable number on the page, because it cannot tell you that the fourth engine treats your category as a two-horse race you are losing.
Two rules follow, and both are cheap to apply. Report every engine as its own column, and set the target per engine rather than against the blend. When a number moves, the engine column tells you where to look first, and the model version column tells you whether anything you did could possibly have caused the move.
A third rule concerns branded prompts. Being named when someone asks about your brand by name is close to guaranteed and tells you almost nothing. The test that matters is the unbranded question: the buyer who describes a problem without naming a vendor. In the worked example, the brand appears in 21.0 percent of all answers and 18.0 percent of unbranded answers, which is a more honest reading of competitive position than either figure alone.

AI Search and Brand Visibility: Measuring Share of Model
Sampling: How Many Answers Before a Number Means Anything
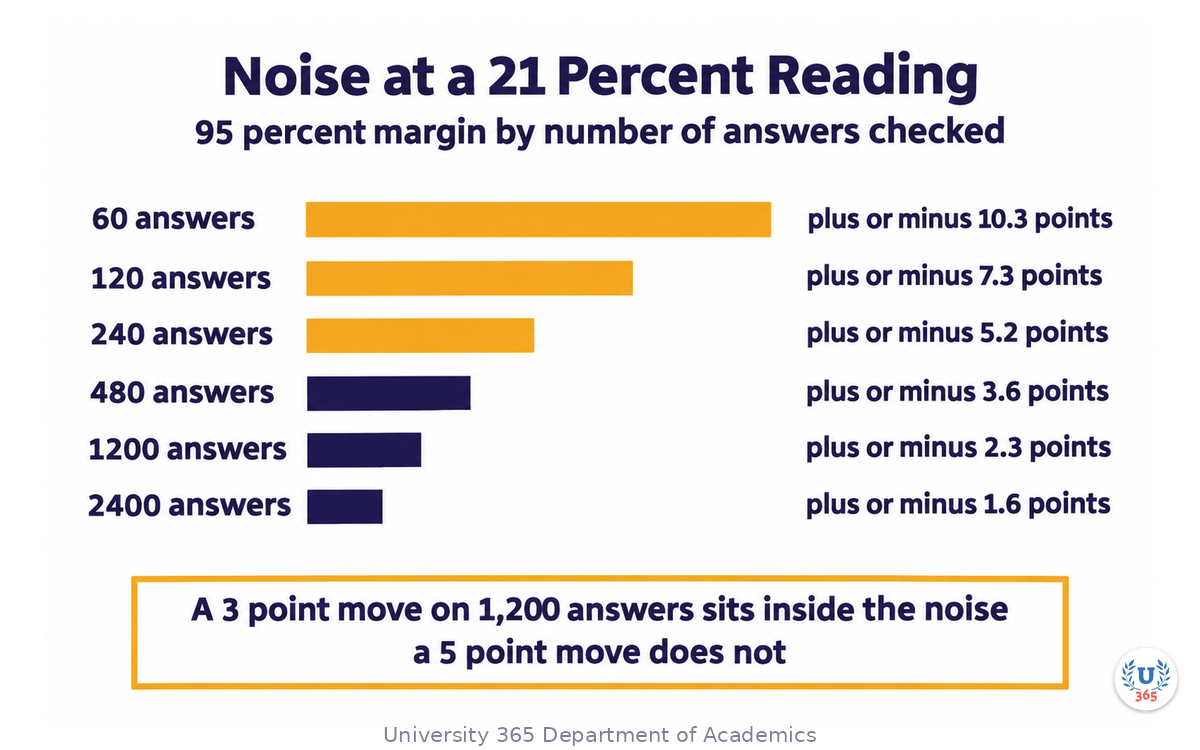
A share of model number is a frequency estimated from a sample. It therefore has a margin, and the margin is usually larger than the movement the marketing team is excited about.
For a proportion near 21 percent, the 95 percent margin is about 1.96 times the square root of (0.21 x 0.79 / n), where n is the number of answers checked. The table is the part you will use.
Answers checked | 95 percent margin | What a 21 percent reading really means |
60 | 10.3 points | between 10.7 and 31.3 percent |
120 | 7.3 points | between 13.7 and 28.3 percent |
240 | 5.2 points | between 15.8 and 26.2 percent |
480 | 3.6 points | between 17.4 and 24.6 percent |
1,200 | 2.3 points | between 18.7 and 23.3 percent |
2,400 | 1.6 points | between 19.4 and 22.6 percent |
Now return to the meeting that opened this lecture. One dashboard asked 25 questions once a week, about 100 answers in a month, with a margin near seven points each way. The other asked 180 questions three times a week, over 2,000 answers, with a margin near two. An eleven-point gap between them is not evidence that either vendor is incompetent. It is what two samples of different sizes do.
The margin also decides what counts as a change. Suppose last month's reading was 21.0 percent on 1,200 answers and this month's is 24.0 percent on 1,200 answers. The difference is three points, and the standard error of that difference is about 1.7 points, so the move is 1.76 standard errors from zero. It is not distinguishable from noise at the conventional 95 percent level. A five-point move, from 21.0 to 26.0, reaches 2.89 standard errors and is worth reporting. A three-point move requires about 1,200 answers on each side before you can call it; a two-point move requires about 2,400 on each side.
Two practical rules follow. Decide the smallest move you care about before you choose the sample size, then size the run to detect it. Never report a decimal place you have not earned. A scorecard that says 21.4 percent when the margin is plus or minus ten points is false precision, and a reader who knows the arithmetic will stop trusting the other eight lines.
Sampling error is not the only noise. Four other sources move the number, and a defensible scorecard names them. Repeat variance: the same prompt on the same engine can return a different answer, so each prompt in the worked example runs five times and the five answers are counted separately. Model version drift: vendors replace versions on their own schedule, so record the version string beside every batch. Prompt-set drift: adding or removing prompts changes the baseline, which is why the next section treats the set as a versioned artefact. Engine policy change: a retrieval change can move a frequency in a week with no change on your side. Spreading the run over five days rather than one afternoon captures some weekly variation and costs nothing extra.

AI Search and Brand Visibility: Measuring Share of Model
Building a Prompt Set You Can Defend
The prompt set is the instrument. Everything downstream inherits its bias, and unlike a survey questionnaire it has no established review process, so you have to invent one.
Start with size. Forty to eighty prompts is the working range for one brand in one market: below forty the margin on any bucket is too wide to act on, above eighty the marginal prompt adds little. The worked example uses sixty, split into four buckets sampled equally so that no bucket dominates the blend by accident.
Bucket | What it asks | Share of the set | Example prompt |
Category discovery | who or what is best for a described need | 30 percent | best CRM for a 40-person sales team in Germany |
Comparison | two or more named options, one of them a competitor | 20 percent | HubSpot compared with Pipedrive for a small sales team |
Problem-led | a symptom, with no vendor named | 25 percent | how do I stop losing deals because follow-up is slow |
Branded | your brand or a competitor by name | 25 percent | is Northwind CRM good for manufacturing sales teams |
Four rules make the set defensible.
Write in buyer language, not marketing language. Take the phrases from sales call transcripts, support tickets and the search queries that already convert. An engine answers the question it was asked, so a prompt written in your positioning vocabulary measures your vocabulary, not your visibility.
One question per prompt. "What is the best CRM for a small team, and how does it compare with HubSpot" is two instruments glued together, and the answer will satisfy whichever half the model chooses.
Keep branded prompts out of the unbranded buckets. A set that mentions your brand in the discovery bucket measures recall, not competitive position, and it will inflate the headline number by a predictable amount.
Freeze and version the set. Record it as v1.0 with a date, keep it in a repository, and treat any change as a new baseline. When you add prompts, publish the new version and start the series again rather than drawing a trend line across two instruments. This is the single most common cause of a chart that shows a dramatic improvement which is entirely an artefact of three new easy prompts.
Finally, write down what the set cannot see. A prompt set drawn from your own sales calls inherits their blind spots: if a competitor wins deals before your team speaks to the buyer, those conversations are absent from the instrument and the scorecard will look better than the market does.

AI Search and Brand Visibility: Measuring Share of Model
Scoring One Answer: The Rubric
Two analysts reading the same 200 answers will produce two different numbers unless the scoring rule is written down first. The rubric is not bureaucracy. It is the difference between a measurement and an opinion.
Score in two passes. The first pass is binary: did the answer name your brand, yes or no. That single bit produces the mention rate, and it is the most reliable number on the scorecard because two trained readers rarely disagree about whether a name is present.
The second pass records attributes for every answer that named you. Five are enough:
Position: the ordinal of your first mention, or "not ranked" when the answer is prose with no order.
Recommendation: whether you appear in the answer's shortlist or top three, as distinct from being mentioned in passing.
Link: whether the answer links to a domain you control, and whether that link is to the page that supports the claim.
Accuracy: whether the description of what you do, your pricing model and your market is factually correct.
Framing: positive, neutral, negative or qualified, with one quoted phrase as evidence.
Keep the five attributes as separate columns rather than collapsing them into a weighted score. A weighted composite is easy to present and hard to defend: the weights are arbitrary, they hide which attribute moved, and they invite the argument you were trying to end. Report the attributes, and if the board insists on one number, report the mention rate with its margin and put the attributes underneath.
Calibrate the readers: double-score a random ten percent, require 90 percent agreement on the binary pass, and write each ruling into the rubric as an example. Worked examples settle disputes that definitions alone cannot.
If a language model does the scoring, fix its version, validate it against at least 50 hand-scored answers and publish the agreement rate. A scorer that drifts from 94 to 81 percent accuracy will move your share of model with nobody touching a prompt.
Log the raw material: every answer with its prompt id, engine, model version, locale, timestamp and a hash of the text. The ability to re-score a past month under a new rubric is the difference between a dashboard and an audit trail.

AI Search and Brand Visibility: Measuring Share of Model
What Google AI Reports Do and Do Not Give You
On 3 June 2026 Google announced generative AI performance reports in Search Console, with a separate report for AI features in Discover. Google's help documentation states that as of 31 August 2026 the reports are available for all websites worldwide. This is the first first-party measurement surface for AI visibility, and it is worth being precise about what it contains.
Field | Available | Consequence for your scorecard |
Impressions in AI Overviews and AI Mode | yes | a floor on presence, measured by the platform |
Pages, countries, devices, dates | yes | diagnosis by page and by market |
Clicks from AI features | no | you cannot compute a click-through rate from this report |
Queries | no | you cannot see which prompts produced the impression |
Competitor share | no | share of model stays a third-party or in-house measurement |
The report answers "did my pages appear". It does not answer "what share of the answer did I own", and it cannot, because it only sees your own property. Treat it as a validation line rather than a scorecard. If your own sampling says your pages appear in Google's AI answers for a set of prompts and Search Console reports zero impressions for the same period, one of the two instruments is wrong, and finding out which is worth an afternoon.
The same announcement introduced a control that lets a site owner decide whether its content appears in and helps ground responses in Google's generative AI features. Google states that sites which opt out will not receive traffic or impressions from those features, and that the control is not used as a ranking signal for results outside them. That is a policy decision with a measurement consequence: opting out sets your Google AI visibility to zero by choice, so record the decision and its date next to the scorecard rather than discovering it as a mystery drop.
Google also published adoption figures in the same announcement: AI Overviews above 2.5 billion monthly active users, AI Mode above one billion. These are company-reported product figures, not audited search volumes, and they say nothing about how often your category triggers an answer.
AI Search and Brand Visibility: Measuring Share of Model
What Readers Do With an AI Answer
A visibility scorecard that assumes a citation produces a visit will overstate its own value. The best independent evidence on reader behaviour comes from Pew Research Center, published on 22 July 2025.
Pew tracked the browsing of 900 U.S. adults in its KnowledgePanel Digital panel between 1 and 31 March 2025, then re-ran each Google search to capture the results page as it appeared between 7 and 17 April 2025. The dataset holds 68,879 unique Google searches, of which 12,593, or 18 percent, produced an AI summary alongside the traditional results.
Reader action | With an AI summary | Without an AI summary |
clicked a traditional search result | 8 percent of visits | 15 percent of visits |
clicked a link cited inside the summary | 1 percent of visits | not applicable |
ended the browsing session on the results page | 26 percent of visits | 16 percent of visits |
Read the middle row twice. A cited source was clicked on one visit in a hundred. The summary absorbs attention, the click does not follow, and the decision the reader made is invisible to your analytics.
Three consequences follow for the scorecard. Impressions inside the answer are the primary unit, not clicks, because that is where the reader's attention stops. A citation is not a visit: model citation share as an awareness and shortlist line, and never convert it into expected sessions with a multiplier you invented. The demand side needs its own lines, because a fall in traditional clicks and a rise in AI mentions can happen in the same month, and a scorecard with one blended line will report the average of two opposite movements.
State the limits when you present it: one country, one month, a panel of adults who agreed to have their browsing tracked. The magnitude will differ for a high-consideration purchase. The direction, fewer clicks and more decisions taken inside the answer, is what makes the measurement necessary.
AI Search and Brand Visibility: Measuring Share of Model
From Visibility to Pipeline
The line between visibility and revenue is short, thin and easy to fake. Handle it with three rules.
Count referrals by referrer, and check the logs. AI engines arrive under their own domains, and client-side analytics undercounts them because in-app browsers sometimes strip the referrer. Compare analytics with a server log sample once a quarter and say which figure you report.
Measure conversion rate, not sessions. Volumes are small enough that a session count swings wildly, while the conversion rate on the traffic that does arrive is the useful signal. In the worked example, 3,120 sessions produced 128 conversions, a rate of 4.10 percent, which is more informative than the session count.
Cross-check with share of search, and stop there. If share of model rises while search demand for your brand is flat or falling, you are being named more often without being chosen more often. If both rise together, the visibility line is doing something real. What you cannot measure is the decision a reader took after reading an answer and then typing your name into a new tab, so do not pretend to. Report the two lines side by side and let the reader see the relationship.
AI Search and Brand Visibility: Measuring Share of Model
The Scorecard: Nine Lines, One Page
Nine lines fit on one page with a header. Anything longer will not be read in the meeting where decisions are taken.
Line | Definition | Denominator | Cadence |
1 Share of model, blended | your mentions by all brand mentions | all answers checked | monthly |
2 Share of model by engine | the same, one column per engine | answers per engine | monthly |
3 Unbranded mention rate | presence on prompts that do not name a brand | unbranded answers | monthly |
4 Recommendation rate | named in the answer's top three | all answers checked | monthly |
5 Citation share | answers linking to a domain you control | all answers checked | monthly |
6 Answer accuracy | mentions that describe you correctly | your mentions | monthly |
7 Framing split | positive, neutral, negative | your mentions | monthly |
8 Share of search | branded by category search volume | category volume | monthly |
9 AI referrals and conversion | sessions and conversion rate from AI engines | sessions | weekly |
The header carries four items that make the page auditable: the prompt-set version and its date, the engines and model versions tested, the number of answers behind each line, and the margin that applies. Without the header the page is a set of numbers with no provenance, and the first person who asks how it was produced will find that nobody can say.
Assign one owner per line. Nine lines with one owner is a report; nine with a named owner each is a management instrument, because each owner can be asked what moved and why.
AI Search and Brand Visibility: Measuring Share of Model
A Worked Scorecard for One Brand
The remaining sections use a fictional mid-market CRM vendor, Northwind, so that the arithmetic can be checked without disclosing anyone's data. The design is the part worth copying.
Sixty prompts, four engines, five samples per prompt: 1,200 answers in the month. Fifteen prompts are branded and forty-five are not, so 300 answers come from branded prompts and 900 from unbranded ones.
Line | Value | Arithmetic | Margin at 95 percent |
1 Share of model, blended | 21.0 percent | 252 mentions of 1,200 answers | plus or minus 2.3 points |
2 Engine: ChatGPT | 27.0 percent | 81 of 300 answers | plus or minus 5.0 points |
2 Engine: Gemini | 24.0 percent | 72 of 300 answers | plus or minus 4.8 points |
2 Engine: AI Overviews | 19.0 percent | 57 of 300 answers | plus or minus 4.4 points |
2 Engine: Perplexity | 14.0 percent | 42 of 300 answers | plus or minus 3.9 points |
3 Unbranded mention rate | 18.0 percent | 162 of 900 answers | plus or minus 2.5 points |
4 Recommendation rate | 11.0 percent | 132 of 1,200 answers | plus or minus 1.8 points |
5 Citation share | 6.5 percent | 78 of 1,200 answers | plus or minus 1.4 points |
6 Answer accuracy | 90.9 percent | 229 of 252 mentions | plus or minus 3.6 points |
7 Framing split | 57.9 / 39.7 / 2.4 percent | 146 / 100 / 6 mentions | plus or minus 6.1 points on positive |
8 Share of search | 8.4 percent | branded by category volume | external tool |
9 AI referrals | 3,120 sessions, 4.10 percent | 128 conversions | not sampled |
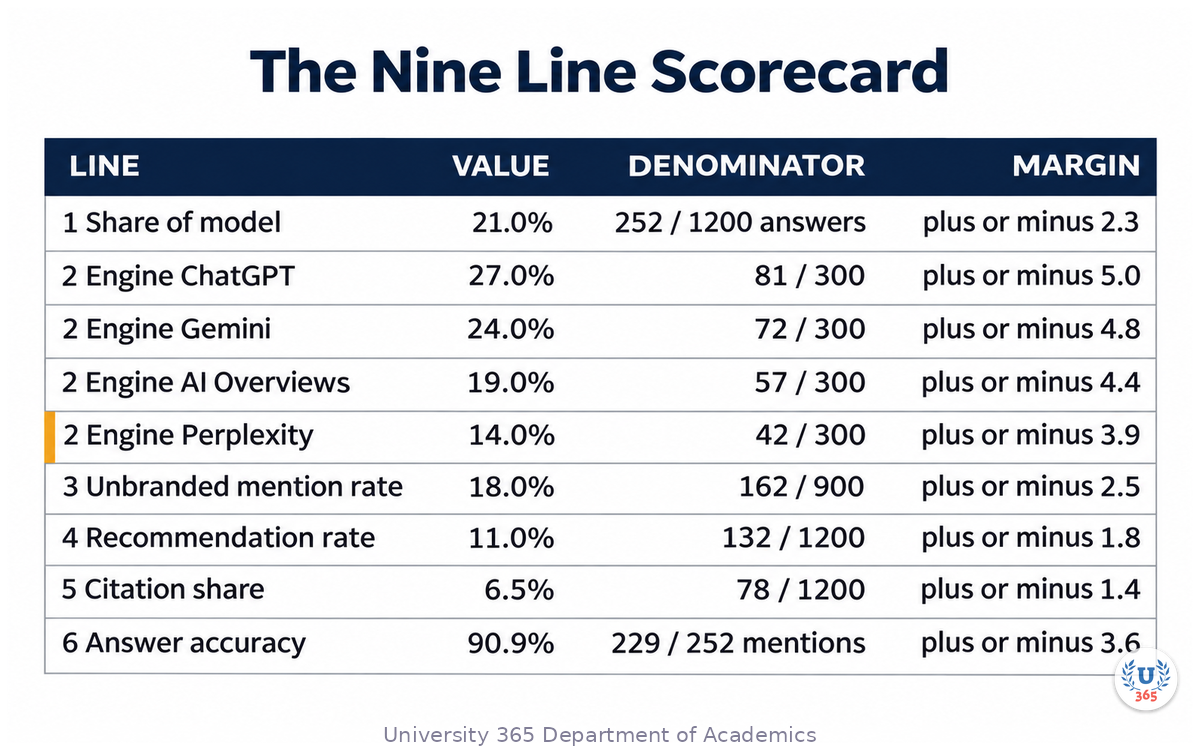
Three readings matter more than the headline.
Perplexity is the weak engine at 14.0 percent, and the gap to the leader is outside the margin. The blend of 21.0 percent cannot show that. If the category is decided by buyers who research in a chat interface, that column is the one to work on first.
Citation share is 6.5 percent against a 21.0 percent mention rate. The engines know the name and do not treat the site as the evidence. In a set of 1,200 answers, 78 links is enough to build on and low enough to explain why referral sessions are modest.
Accuracy is 90.9 percent, so roughly one mention in eleven describes the company wrongly. Fixing that is a content task with a clear owner and it will not move the mention rate, which is the point of separate lines.
AI Search and Brand Visibility: Measuring Share of Model
Five Ways AI Visibility Reporting Fails
One sample per prompt. A single run per question produces a number with a margin near ten points at this reading. Fix: three to five samples, spread across days.
Prompt-set drift. Prompts are added mid-series and the chart shows an improvement that is only a change of instrument. Fix: version the set and restart the series on any change.
The blended average. One number hides an engine that has stopped naming you. Fix: per-engine columns, with the blend kept as a summary.
Mentions counted as citations. A brand named in prose is not a source, and treating the two as one inflates the value of the work. Fix: separate lines, separate definitions.
False precision. Reporting 21.4 percent with a margin of ten points, or a one-point move as a trend. Fix: round to the margin and mark moves inside the noise.
A sixth failure is a governance problem: a scorecard with no owner. A number nobody owns is a number nobody acts on, and it will be dropped from the deck within two quarters.
AI Search and Brand Visibility: Measuring Share of Model
What to Do With a Low Score
Diagnose by line, never by the total. Five patterns cover most cases, and each has a different first action.
Absent on every engine. The problem is entity clarity. Check that your name, category and description are stated the same way on your site, in directories, in reviews and in trade coverage, and that a crawler can reach those pages.
Absent on one engine, present elsewhere. The problem is usually access or locale: a crawler excluded by a rule, content behind a script, or a market where your sources do not exist in the local language.
Named but never recommended. The engines know you exist and do not put you in the shortlist. The work is comparative and use-case evidence: pages that state who the product is for, what it does not do, and how it compares on the criteria buyers actually use.
Recommended but not cited. You are trusted in the answer and not used as the source. The work is answer-ready pages: the fact, the number, the date, stated plainly near the top of a page that the crawler can read.
Cited but described wrongly. The source that the engine reads is out of date or ambiguous. Fix the source, then re-measure, and expect the correction to appear on the engine's own schedule rather than yours.
This lecture stops at diagnosis. The tactics that move each line are the subject of Generative Engine Optimization: Winning the AI Answer, and the discipline of measuring whether they worked is the subject of this page.
AI Search and Brand Visibility: Measuring Share of Model
The Quarterly Review: Three Decisions
Once a quarter, put the nine lines in front of the people who can act, and take three decisions in fifteen minutes.
Which engine gets the next quarter's work. Choose by the size of the gap against its own margin, not by the size of the blended number.
Which accuracy defect is fixed first. Rank the wrong descriptions by how many answers carry them and how badly they mislead.
Whether the prompt set changes. If the product, the market or the buyer language has moved, release a new version, accept a new baseline, and say so on the chart.
Record each decision with the month, the owner and the line expected to move. A scorecard that produces decisions is a measurement system; one that produces commentary is a newsletter.

AI Search and Brand Visibility: Measuring Share of Model
Feynman Summary: Explain It Like You Are 12
Imagine you want to know how often a shop assistant recommends your product. You cannot ask every assistant in the world, so you ask a sample.
Ask sixty times and 21 percent could easily be 11 or 31, because sixty answers is a small sample. Ask twelve hundred times and the same 21 percent is probably between 19 and 23. That is why two dashboards can disagree by eleven points and both be honest: they asked different numbers of questions.
Three numbers hide inside "how visible are we". How often you are named at all. How much of all the brand names mentioned are yours. How often the answer links to your website. Each has its own bottom number, and mixing them up makes an argument you cannot win.
Ask the same questions every month. Write down which questions you asked, which engines you used, which version of each model answered, and how you decided whether your brand counted. If you change the questions, start a new chart, because the old line no longer measures the same thing.
Last part. When an assistant names you, a reader almost never clicks: Pew measured a click on a cited source in one visit out of a hundred. So do not count a citation as a visit. Count it as being present when the decision is made, and measure visits separately.

AI Search and Brand Visibility: Measuring Share of Model
Mindmap: The Complete Picture
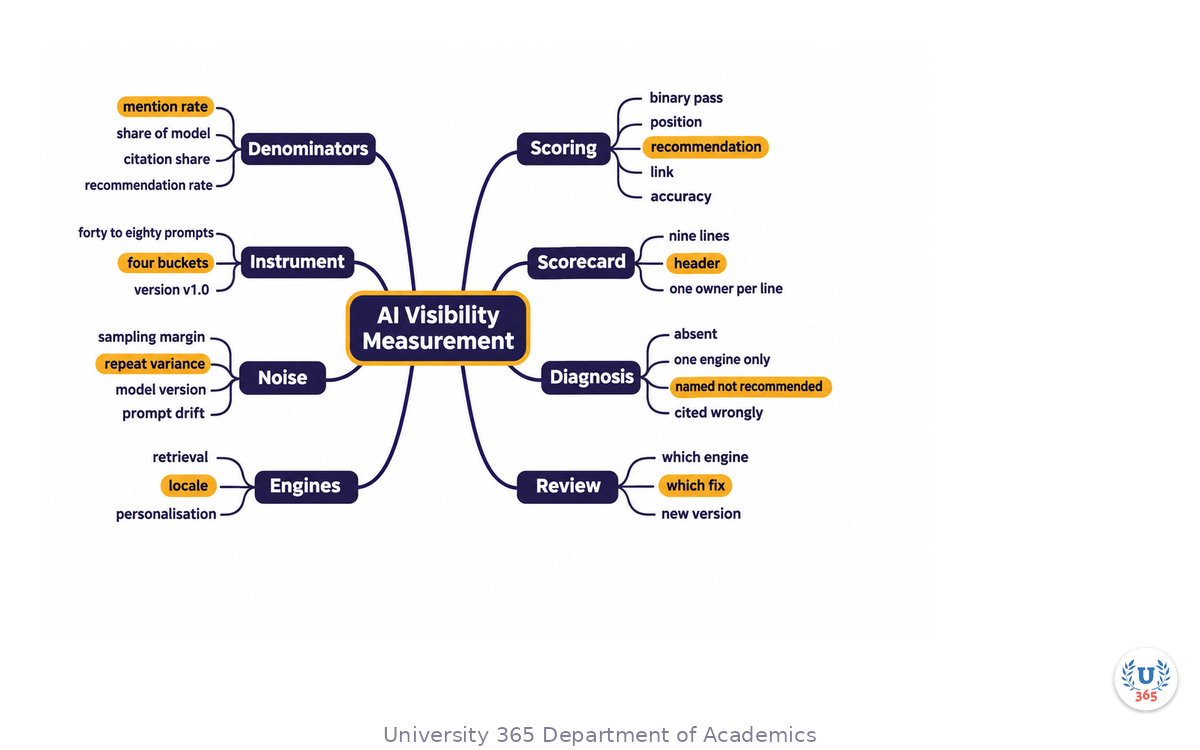
The mindmap carries eight branches: the four denominators; the instrument, meaning prompt set, version and buckets; the sources of noise; the engines; the scoring pass and its five attributes; the nine scorecard lines and the header; the five diagnostic patterns; and the three review decisions.
UNOP Sound (University 365 Neuroscience Oriented Pedagogy)
Take five minutes to consolidate your memory. Play the isochronous tone track (10Hz alpha frequency) with your eyes closed. Alpha-frequency tones after a learning session support consolidation, helping move what you just learned from short-term to long-term memory.
[Audio player: UNOP Post-Lecture Isochrone (10Hz, 5 minutes)]
AI Search and Brand Visibility: Measuring Share of Model
Practical Exercise: Build the Scorecard for One Brand
Set aside two afternoons. Work on one brand in one market, and finish with a page you would be willing to defend.
Afternoon one, design.
Choose the brand and name five competitors. Write the category in one sentence, in the buyer's words.
Write forty prompts in the four buckets, using phrases from sales calls, support tickets and existing search queries. Thirty percent discovery, twenty percent comparison, twenty-five percent problem-led, twenty-five percent branded.
Freeze the set as v1.0 with today's date and store it where a colleague can find it.
Choose three engines you can access and record the product and model version of each.
Decide your sample: five runs per prompt, spread over five days.
Afternoon two, measure and score.
Run the set. Log every answer with prompt id, engine, model version, locale, timestamp and a hash of the text.
Score the binary pass on every answer, then the five attributes on every answer that named the brand.
Double-score a random ten percent. If agreement is below 90 percent, revise the rubric and rescore before computing anything.
Compute the nine lines. For each proportion, compute the margin with 1.96 times the square root of p times (1 minus p) divided by n, and write it beside the number.
Write the one-page summary: nine lines, the header, three readings, and the three decisions you would take next quarter.
Stop when the page is defensible. Honest margins and three decisions are worth more than two hundred charts and no owner.

AI Search and Brand Visibility: Measuring Share of Model
Glossary
Term | Definition |
Share of model | A brand's mentions in a set of AI answers divided by all brand mentions in those same answers, multiplied by 100 |
Mention rate | The share of answers checked in which the brand appears at all, with answers as the denominator |
Citation share | The share of answers that link to a domain the brand controls, counted separately from being named |
Recommendation rate | The share of answers in which the brand appears in the answer's shortlist or top three, rather than in passing |
Prompt set | The frozen, versioned list of buyer questions used as the measuring instrument for every visibility number |
Repeat variance | The change in an answer when the same prompt is run again on the same engine, which is why each prompt is sampled more than once |
Margin of error | The range within which a sampled frequency would fall if the whole population were measured, at a stated confidence level |
Grounding | The step in which an AI engine retrieves sources and ties the claims in its answer to those sources |
Share of search | Searches for a brand divided by searches for its category, used as a stable cross-check on AI visibility |

AI Search and Brand Visibility: Measuring Share of Model
Quiz: TEST YOUR UNDERSTANDING
1. A brand appears in 252 of 1,200 answers, and those answers name 2,880 brands in total. What is its share of model?
A) 21.0 percent
B) 8.75 percent
C) 11.0 percent
D) 6.5 percent
2. A reading of 21 percent comes from 60 answers. What does the 95 percent margin tell you?
A) The true value is exactly 21 percent
B) The value lies within about plus or minus 10.3 points
C) The sample is large enough to report a trend
D) The engine is unreliable
3. Share of model moves from 21.0 to 24.0 percent on 1,200 answers in each month. What is the correct reading?
A) A confirmed improvement
B) A move inside the noise at 95 percent confidence
C) A change of instrument
D) Evidence that the prompt set is broken
4. What does the Search Console generative AI performance report give a site owner?
A) Impressions, pages, countries, devices and dates
B) Clicks and click-through rate
C) Competitor share of model
D) The queries that triggered each answer
5. In Pew's 2025 panel, how often did users click a source cited inside an AI summary?
A) 1 percent of visits with a summary
B) 8 percent of visits with a summary
C) 15 percent of visits with a summary
D) 26 percent of visits with a summary
Answers: 1-B, 2-B, 3-B, 4-A, 5-A

Related Resources
U365 INSIDE Publications
External Resources
Google Search Central, Search Generative AI performance reports in Search Console (3 June 2026)
Google Search Console Help, Generative AI performance report
Google, New opportunities and control for website owners (3 June 2026, updated 31 August 2026)
Aggarwal and others, GEO: Generative Engine Optimization, KDD 2024
Related U365 Lectures (Coming Soon)
Synthetic Media and Provenance: C2PA, Watermarks and Trust (Marketing Series)
Voice Production with AI: Narration, Podcasts and Audio Branding (Marketing Series)
Reputation Defense in the Synthetic Media Era (Marketing Series)
AI Search and Brand Visibility: Measuring Share of Model
U.Copilot for This Lecture
You are my AI visibility measurement analyst. I need a share of model scorecard I can defend in a board review, not a dashboard tour. My brand: [name, one sentence on what you sell, five competitors] My market: [countries and languages] What I can access: [engines and interfaces I can query] Do five things: 1. Draft a 40-prompt set in four buckets (category discovery, comparison, problem-led, branded) in my buyer language, and name the prompts you consider weak instruments. 2. Specify the run: engines, samples per prompt, days to spread over, fields to log for every answer. 3. Write the rubric for one answer: binary pass first, then position, recommendation, link, accuracy and framing, each with a worked example. 4. Compute the sample size I need to detect a 3 point move at 95 percent confidence, and the margin at the size you propose. 5. Build the nine-line scorecard with the denominator under every line, an owner and a cadence for each. State every number as a computed value with its denominator. Do not estimate a frequency without telling me the sample size behind it.
AI Search and Brand Visibility: Measuring Share of Model
Next Steps
Write the three denominators into a one-page template this week: mention rate, share of model and citation share, each with its own bottom number.
Draft forty prompts from real sales calls and support tickets, freeze them as v1.0 with today's date, and store the file where a colleague can find it.
Decide your smallest useful move and size the run to detect it: about 1,200 answers per side for a three-point move, about 2,400 for two points.
Score a random ten percent twice, publish the agreement rate, and rewrite the rubric wherever two readers disagreed.
Add the Search Console generative AI impressions line as a validation column, and check that it agrees with your own sampling on Google.

AI Search and Brand Visibility: Measuring Share of Model
IMPORTANT NOTICE
Copyright University 365, Inc. All rights reserved. This lecture is provided for educational purposes and does not constitute legal, financial or professional advice. For enrollment, visit university-365.com/tuition. For permissions or inquiries, contact uda@university-365.com.
Published by the Department of Academics, University 365.
Lecture delivered by the University 365 Institute of Communication (UIC).
Lea Loringam, Dean of Communication, UIC
Signed for the academic year 2026.




Comments