
Sentiment Analysis for Brand Monitoring



UIC University 365 Institute of Communication
Series Marketing | Level Basic (Free)
Duration 15 to 20 minutes | Access Free
Digital Communication, Marketing, Branding, Content Strategy, Media Studies

UNOP Sound (University 365 Neuroscience Oriented Pedagogy)
Take five minutes to prepare your brain. Play the isochronous tone track (40Hz gamma frequency) with your eyes closed. Gamma-frequency tones before a learning session raise attention and make the material easier to absorb.
[Audio player: UNOP Pre-Lecture Isochrone (40Hz, 5 minutes)]
In this Lecture

The Hook: The Mention You Never Saw
A customer posted a two-paragraph complaint about your delivery times at 21:40 on a Tuesday. By Thursday it had 400 reactions and eleven replies, three of them from people saying they had the same experience. You found it on Friday, in a direct message from a friend.
The complaint was accurate. It was specific. It named the process, not the person. It was, in other words, the most useful piece of customer research you received that quarter, and it reached you three days late and second-hand.
The old answer was a media monitoring contract, priced for companies with a communications department and a budget line. The new answer is a pipeline you can build in an afternoon: collect the mentions, classify the sentiment, group them by theme, and alert a human when something is worth answering.
This lecture builds that pipeline. You will finish knowing how sentiment is actually measured, why most sentiment scores are less reliable than they look, and which decisions the score can support and which it cannot.
Step 1: What Sentiment Analysis Actually Measures
Sentiment analysis assigns a label to a piece of text. The labels look simple. The measurement is not.
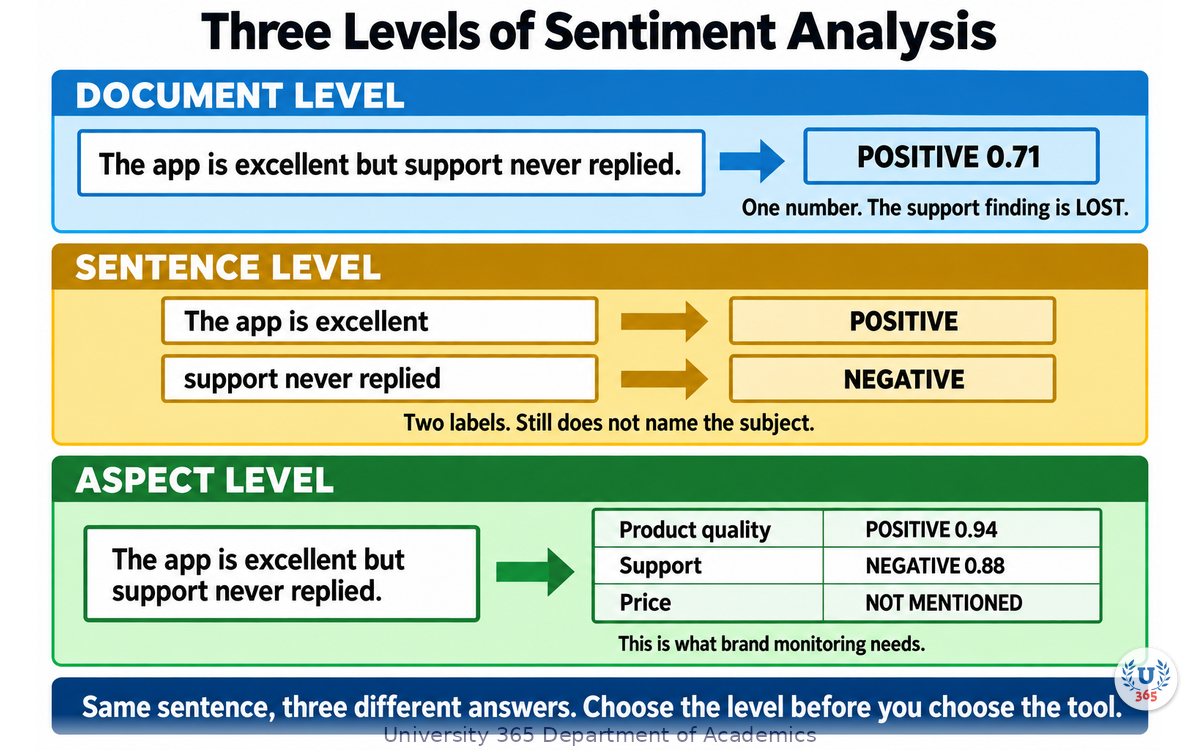
Three levels of granularity, in increasing difficulty:
Level | Question it answers | Example |
Document | Is this whole post positive, negative or neutral? | One review, one score |
Sentence | Which sentence carries the feeling? | A positive review with one angry sentence |
Aspect | How does the writer feel about each specific thing? | Delivery 2/5, product quality 5/5, price 4/5 |
Aspect-level analysis is what you actually want for brand monitoring, and it is the hardest of the three. A document-level score on a review that says "the app is excellent but support never replied" returns one number and loses the finding.
The three-value scale is a lie of convenience. Most tools output positive, negative or neutral. Real writing contains:
Mixed sentiment inside one sentence. "Faster than the old version, but it crashed twice."
Sarcasm. "Great, another mandatory update." The words are positive and the meaning is not.
Negation chained across clauses. "I did not expect to like this, and I still do not."
Domain shifts. "Sick" is negative in a hospital review and positive in a skateboard review.
A sentiment model reports confidence for a reason. A score of 0.62 positive is not the same finding as 0.96 positive, and treating them the same is how you end up reporting noise to a leadership team.
What the score is and is not. A sentiment score is an index, not a verdict. It is useful for tracking change over time within one brand and one topic. It is not a measure of your reputation, and comparing your score with another brand's score from a different tool measures the tools more than the brands.
Step 2: Where the Data Comes From
Collection is the part of the pipeline people under-plan, and it is the part that determines whether the rest is worth doing.
Four categories of source, each with a different access reality:
Source | Access route | What it gives you | Reality check |
Owned channels | Your own platform APIs and exports | Reviews, support tickets, survey answers, comments | Highest signal, fully yours, usually a small volume |
Social platforms | Official APIs where they exist | Posts, comments, replies, mentions | Access terms change; several platforms restrict retrieval and some prohibit scraping |
Review and marketplaces | Published review pages and official review APIs | Star ratings with text, product-level detail | Structured and high-intent, often the best cost-benefit |
News and blogs | RSS feeds and publisher APIs | Coverage and commentary | Low volume, high impact |
The three collection rules.
Use the official interface wherever one exists. Platform APIs and export files give you stable, permitted access. Retrieval outside the published terms creates legal exposure and breaks without warning.
Capture the metadata, not just the text. Timestamp, platform, author type (customer, prospect, journalist, competitor employee), language, and a permalink. A mention with no timestamp cannot be trended; a mention with no permalink cannot be answered.
Record the sampling rule. If you collect only mentions containing the brand name, you miss the ones that describe the experience without naming you. Write down what your filter includes and excludes, and revisit it quarterly.
Volume honesty. A small brand may see 20 mentions a week. That is a good dataset for reading, and a bad dataset for statistics. Do not build a percentage change on 20 items: one extra complaint moves the number by five points. Read the mentions at that volume, and start trending when the weekly count is stable above roughly 100.
Step 3: The Three Methods, and What Each One Costs
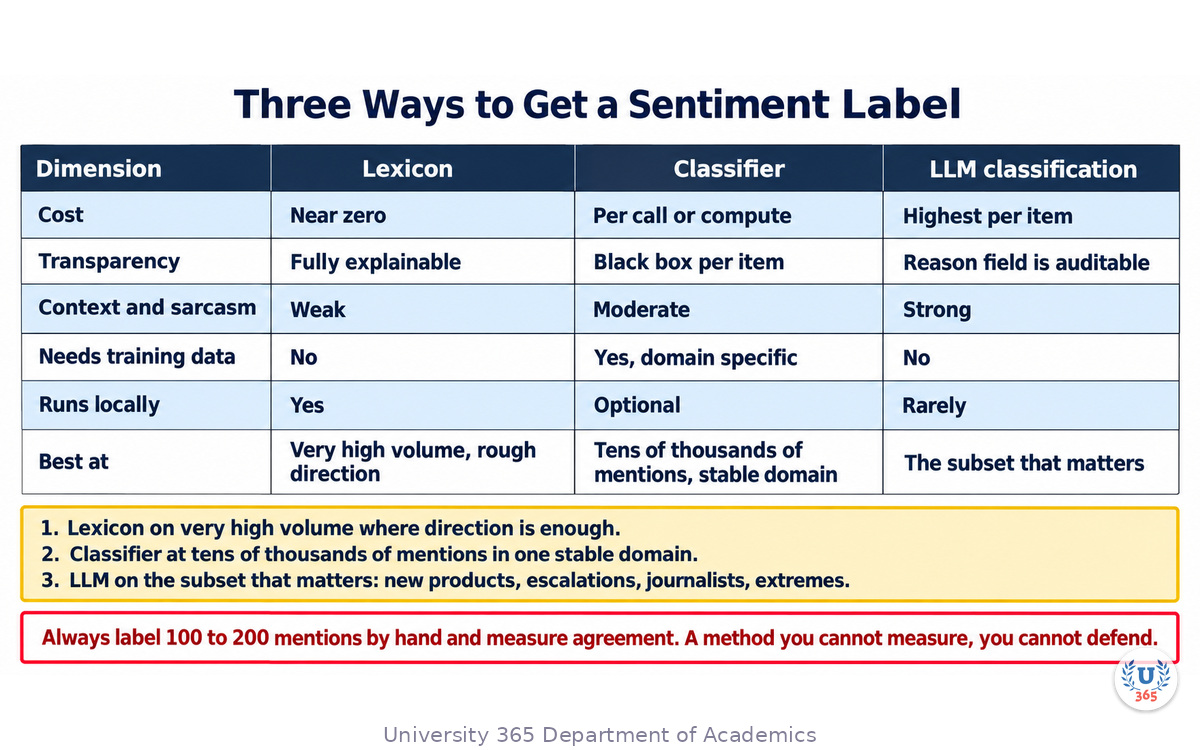
There are three ways to get a sentiment label. They differ in cost, transparency and accuracy, and the right answer is usually a combination.
1. Lexicon-based scoring. A dictionary maps words to scores ("excellent" +2, "broken" -2) and the text is summed, with rules for negation and intensity.
Cost: effectively zero, runs locally, no data leaves your systems.
Strength: fully explainable. You can open the dictionary and see why a score came out where it did.
Weakness: blind to context. It misses sarcasm, domain shifts and mixed sentences.
2. Machine learning classifiers. A model trained on labelled text predicts the label. Available as hosted APIs or small open models you run yourself.
Cost: per-call pricing on hosted services, or compute if self-hosted.
Strength: handles context and negation far better than a dictionary.
Weakness: it is a black box on a per-item basis, and accuracy is domain-specific. A model accurate on restaurant reviews may be weak on enterprise software complaints.
3. Large language model classification. You pass a batch of mentions with a structured instruction and receive labels plus a one-line reason.
Cost: the highest per item, but falling, and zero training work.
Strength: handles context, sarcasm and mixed sentiment, and can classify aspect and intent at the same time. The reason field is what makes it auditable.
Weakness: cost at volume, output variability, and the need for a fixed instruction to keep labels comparable across runs.
Practical guidance.
Use a lexicon on very high volume where you only need a rough direction.
Use a hosted classifier when you have tens of thousands of mentions and a stable domain.
Use an LLM on the subset that matters: mentions of new products, escalations, journalists, high-reach posts, and anything the cheap layer scored as extreme.
Always run a human-labelled sample of 100 to 200 mentions against whichever method you choose, and compute agreement. A method you cannot measure is a method you cannot defend in a meeting.
The scoring brief that keeps LLM labels comparable. Fix the scale, the output shape and the tie rules once, then reuse it verbatim:
Classify each mention for brand monitoring. Output one JSON object per line: {"id": ..., "sentiment": "positive|negative|neutral|mixed", "aspect": "<product|delivery|support|price|other>", "intent": "<praise|question|complaint|churn_risk|none>", "reason": "<one short line>"} Rules: use "mixed" when one mention clearly contains both strong positive and strong negative statements. Mark intent "churn_risk" only when the writer states or clearly implies they will stop using the brand. Never infer a fact the text does not state.
Step 4: Building the Pipeline
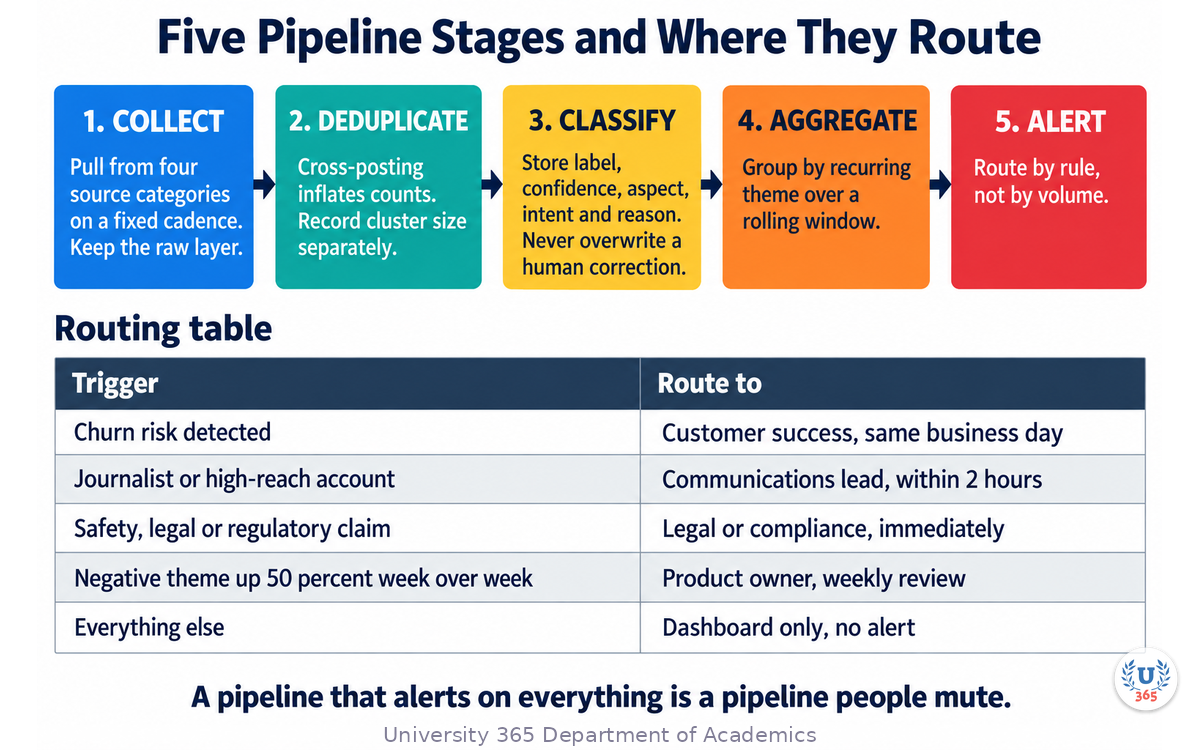
Five stages. Each one is small, and each one can be run on a schedule.
Stage 1, collect. Pull from the sources chosen in Step 2 on a fixed cadence. Store raw items untouched, in a table with the raw text and the metadata. Keep the raw layer: your classification rules will change, and you will want to re-run them.
Stage 2, deduplicate. Cross-posting is the biggest source of inflation in brand monitoring. One complaint published to three platforms and shared four times is one complaint. Deduplicate on a normalised text similarity plus an author and time window, and record the cluster size as a separate field. Cluster size is a useful signal; counting it as seven mentions is not.
Stage 3, classify. Apply the method from Step 3. Store the label, the confidence, the aspect, the intent and the reason. Never overwrite a human correction: keep the machine label and the human label in separate columns so you can measure where the method drifts.
Stage 4, aggregate. Group by theme over a rolling window. A theme is a recurring subject, not a keyword: "delivery delay", "invoice confusion", "battery life". Roll up counts, the sentiment mix, and the reach of the top items per theme.
Stage 5, alert and route. Nothing in the first four stages matters unless it reaches a person. Route by rule, not by volume:
Trigger | Route to | Within |
Churn risk intent detected | Customer success | Same business day |
Journalist or high-reach account | Communications lead | 2 hours |
Safety, legal or regulatory claim | Legal or compliance | Immediately |
Negative theme count up 50 percent week over week | Product owner | Weekly review |
Everything else | Dashboard only | No alert |
Cadence that fits a small team. Collect hourly or daily depending on volume, classify on the same run, aggregate nightly, send one digest each morning and immediate alerts only for the top three rules. A pipeline that alerts on everything is a pipeline people mute.
Step 5: The Dashboard That Answers a Question
Most sentiment dashboards fail for the same reason: they show what is easy to compute instead of what someone needs to decide.
Build the dashboard backwards from the decisions. For brand monitoring there are five real decisions:
Do we need to respond to something today?
Is a specific product or process generating complaints?
Did last week's change make things better or worse?
Which channel deserves more attention?
Is a narrative forming that we should address publicly?
Each decision has one view:
Decision | View | Metric |
Respond today? | Alert queue | Open items by severity and age |
Product or process problem? | Theme table | Mentions per theme, sentiment mix, week over week |
Did the change work? | Trend line | Sentiment mix on the affected theme, before and after |
Which channel matters? | Channel table | Volume, negative share, average reach |
Is a narrative forming? | Narrative tracker | Co-occurring terms, top accounts, velocity |
Two discipline rules for the numbers.
Always show the denominator. "Negative mentions up 40 percent" means nothing without "from 10 to 14 of 300". Small counts move in large percentages.
Never show a single composite score without its components. A "brand health index" that merges sentiment, volume and reach hides the three findings it was built from. Show the parts.
Step 6: From Signal to Response
A dashboard is not a communications strategy. What you do with a detected negative mention follows a small decision tree.
Classify the mention before you reply.
Accurate and specific. Thank the writer, state what you are doing, and give a route to follow up. One competent reply to an accurate complaint is worth more than ten defensive ones.
Accurate but general. Ask one clarifying question in public and move the detail to a private channel.
Inaccurate and specific. Correct the fact once, calmly, with a source. Do not repeat the wrong claim in your reply.
Abusive or coordinated. Do not engage. Record it, note the pattern, and move on. Engagement is the goal of coordinated abuse.
Timing. For a service complaint, reply within one business day. For a safety or legal claim, do not reply at all until the responsible function has cleared the wording. For a journalist, respond within hours, even if the answer is "we are checking and will come back today".
What not to do. Do not send a template that does not engage with the specific text. Do not argue about the sentiment score with the customer. Do not delete an accurate complaint. Do not turn a single mention into a public statement.
Feed the finding back. Every recurring negative theme belongs in one of three places: the product backlog, the process documentation, or the FAQ. A monitoring programme that produces replies but never changes a process is a cost centre.
Step 7: Where Sentiment Analysis Fails
The failures are predictable, and knowing them is what keeps the output trustworthy.
1. Sarcasm and irony. "Love that the app logs me out every hour" scores positive on a lexicon and often neutral on a classifier. LLM classification handles it better, not perfectly.
2. Negation scope. "Not bad at all" and "not good at all" differ by one word.
3. Domain and dialect drift. Product names that are ordinary words ("Excel", "Pages", "Teams") produce constant false matches unless the filter requires context. Regional slang, emoji and abbreviations vary by community.
4. Aspect confusion. A sentence praising the product and criticising the price must produce two labels, not one average.
5. Selection bias. People who write about a brand are not a random sample of its customers. Your sentiment mix measures the vocal subset, and quiet dissatisfaction never appears. Treat the pipeline as a detection system for themes, not as a satisfaction survey.
6. Translation loss. A pipeline that translates first and then classifies adds a second error on top of the first. Where volume justifies it, classify in the original language with a model that supports it.
7. Feedback loops. If you act only on what the pipeline flags, the pipeline's blind spots become your blind spots. Read a random sample of raw mentions every week, unfiltered, to test the system against reality.
The professional habit. For any claim you make from this data, be able to say: how many items, over what period, collected how, classified by which method, with what measured agreement against a human sample. If you cannot answer those five, you have an impression, not a finding.
Feynman Summary: Explain It Like You Are 12
Imagine your football club has a team page and hundreds of people write comments about it.
Some comments say "great match". Some say "the coach is terrible". Some say "I loved the first half but the goalkeeper was awful". If you only count "good words" and "bad words", the last comment goes wrong: it has good words and bad words in the same sentence.
So you do three things. First you gather all the comments in one place, without copying the same person's comment five times. Then you read each one and decide: happy, angry, or a bit of both, and about what? The goalkeeper, or the coach, or the price of tickets? Then you count them by subject and week, so you can see that people are getting angrier about ticket prices but happier about the goalkeeper.
The important part is what you do next. If someone is angry about a real problem, you fix the problem. Counting angry comments without fixing anything changes nothing. And you must remember that only the loudest people write comments. The quiet ones never say anything, so you cannot say "everyone is happy".
Mindmap: The Complete Picture
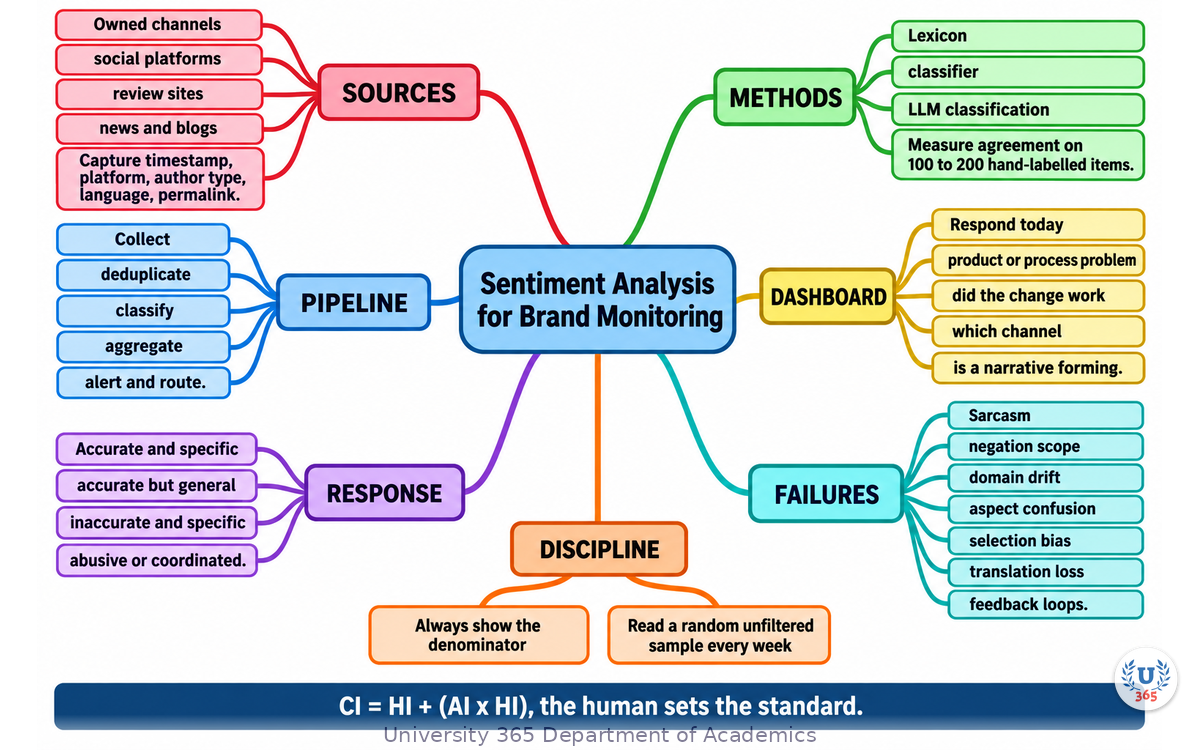
The mindmap shows the four source categories, the three classification methods with their trade-offs, the five pipeline stages, the alert routing rules, the five dashboard decisions, and the seven known failure modes with the human check attached to each.
UNOP Sound (University 365 Neuroscience Oriented Pedagogy)
Take five minutes to consolidate your memory. Play the isochronous tone track (10Hz alpha frequency) with your eyes closed. Alpha-frequency tones after a learning session support consolidation, helping move what you just learned from short-term to long-term memory.
[Audio player: UNOP Post-Lecture Isochrone (10Hz, 5 minutes)]
Practical Exercise: Monitor One Brand for 24 Hours
Exercise: One Brand, One Day, Five Numbers
Choose a brand you can observe legally from public pages. Your own is the best choice. If you have no brand, use a small local business whose reviews are public.
Write the sampling rule first. One sentence: which pages, which search terms, which language, which time window. Save it.
Collect 50 to 200 mentions from two of the four source categories. Copy the text, timestamp, platform, author type and permalink into a spreadsheet.
Deduplicate by eye. Record how many mentions collapsed into clusters and what the largest cluster was.
Label 100 mentions by hand, if you have them, using the four labels positive, negative, neutral, mixed, plus an aspect and an intent.
Run the same 100 through one automated method, using the scoring brief from Step 3 verbatim.
Compute agreement. How many labels matched? Write down the three items you disagreed on most and why.
Group by theme. Name three recurring subjects and count mentions per theme.
Draw the two views you would actually look at each morning: the alert queue and the theme table.
Pick one theme and write the sentence you would say to the product or process owner.
What to Observe
How many of the 100 items were mixed or sarcastic? Was that more or fewer than you expected?
Which failure mode from Step 7 appeared most often in your own sample?
Did the automated method get the easy cases right and the hard cases wrong, or did it fail randomly?
How many mentions would it have taken before the percentage change became meaningful?
Which single theme, if fixed, would remove the largest share of negative mentions?
Applied AI Connection
You chose the sources, wrote the sampling rule, labelled the sample and measured the method against your own judgement. The tools classified at volume and grouped the text. That is the CI-First pattern: CI = HI + (AI x HI). The human sets the standard the machine is measured against, and the machine handles the volume the human cannot.
Glossary
Term | Definition |
**Sentiment analysis** | The automated assignment of a positive, negative, neutral or mixed label to a piece of text. |
**Aspect-based sentiment** | Sentiment measured per subject inside a text, such as delivery, product quality and price separately. |
**Lexicon-based scoring** | Sentiment scoring from a dictionary of scored words with negation and intensity rules, fully explainable and context-blind. |
**Classifier** | A model trained on labelled examples to predict a label for new text, more context-aware and less transparent than a lexicon. |
**Confidence score** | The model's own estimate of how sure it is, which matters as much as the label itself. |
**Mixed sentiment** | One text containing both strong positive and strong negative statements, which a single label cannot represent. |
**Churn risk** | An intent signal where the writer states or clearly implies they will stop using the brand. |
**Deduplication** | Collapsing the same content reposted or shared across platforms into one item with a cluster size. |
**Cluster size** | The number of copies one mention produced, a useful reach signal that must not be counted as separate mentions. |
**Sampling rule** | The written definition of which content a collection filter includes and excludes. |
**Selection bias** | The distortion created because people who write about a brand are not a random sample of its customers. |
**Denominator** | The total from which a percentage is drawn, without which a change figure is meaningless. |
**CI-First** | Co-Intelligence First: the U365 principle that the human is the orchestrator and the AI is the amplifier. CI = HI + (AI x HI). |
**UP-Context Method** | University 365 Prompting-Context Method: a structured approach to prompting with explicit context blocks for consistent output. |
Quiz: TEST YOUR UNDERSTANDING
1. Why is aspect-level sentiment more useful than document-level sentiment for brand monitoring?
A) It runs faster
B) It separates feelings about different subjects inside one text, such as delivery versus price
C) It removes the need for deduplication
D) It produces one number instead of several
2. A review reads "the app is excellent, but support never replied". A document-level classifier returns one label. What is lost?
A) Nothing, the label is sufficient
B) The negative support finding, which is the actionable part
C) The author's identity
D) The platform metadata
3. Why deduplicate before counting?
A) To reduce storage cost
B) Because one complaint reposted across platforms would otherwise be counted as many mentions
C) Because platforms require it
D) To make the sentiment score more positive
4. You see "negative mentions up 40 percent". What must accompany that figure?
A) A confidence interval only
B) The denominator, such as 10 to 14 of 300
C) The brand's revenue
D) The competitor's score
5. Which failure mode means your sentiment mix should never be read as a satisfaction survey?
A) Negation scope
B) Sarcasm
C) Selection bias, because only the vocal subset writes publicly
D) Translation loss
Answers: 1-B, 2-B, 3-B, 4-B, 5-C
Related Resources
U365 INSIDE Publications
Lecture: AI for Social Media Strategy: The campaign side of the channel this pipeline monitors
Lecture: Brand Voice in the AI Era: Keeping replies consistent with the brand's voice
Lecture: Crisis Communication in the AI Age: What to do when a negative theme becomes public
External Resources
Brandwatch: Enterprise social listening with aspect-level classification
Talkwalker: Consumer intelligence and sentiment dashboards
Google Alerts: Free mention monitoring for news and blogs
Trustpilot and Google Business Profiles: Structured review sources with export options
Hugging Face: Open sentiment classification models you can run on your own hardware
Related U365 Lectures (Coming Soon)
Lecture 2: AI for SEO: Content That Ranks (UIC, Marketing Series)
Lecture 6: The AI Press Release: Automating PR (UIC, Content Strategy Series)
Lecture 10: Crisis Communication in the AI Age (UIC, Branding Series)
U.Copilot for This Lecture
Discuss this lecture with U.Copilot, your AI chat companion trained on this content.
Copy and paste the following prompt into the U.Copilot chat on university-365.com:
You are U.Copilot for Lectures, an AI chat companion specially trained on University 365 lecture content. You are helping a Fellow who just completed the lecture "Sentiment Analysis for Brand Monitoring" from the Marketing Series at the U365 Institute of Communication (UIC). Your role is to help the Fellow build and read a brand monitoring pipeline. You can: - Help them write the written sampling rule for their own brand before they collect anything - Compare lexicon, classifier and LLM classification for their specific volume and languages - Review their labelling brief and explain how to measure agreement against a human sample - Design the five dashboard views backwards from the decisions their team actually makes - Write the alert routing rules and the response decision tree for their context - Stress-test any claim they want to make from the data by asking for the count, period, method and agreement Always maintain U365's CI-First approach: the Fellow defines the standard and the machine handles the volume. Remind them to show denominators and to read a random unfiltered sample every week. Use the UP-Context Method: provide context-rich, role-aware responses that account for the Fellow's data maturity and goals.
Next Steps
Now that you can monitor a brand with real data instead of impressions, here is what to do next:
Write your sampling rule today, before you collect anything, and save it where future you can find it
Label 100 mentions by hand and keep them: they are the only honest benchmark your pipeline will ever have
Build the alert queue first, not the dashboard, so something reaches a person this week
Pick one recurring negative theme and take it to a product or process owner with the count attached
Continue with Lecture 2 in this series, "AI for SEO: Content That Ranks", to apply the same discipline to search demand
Explore the Marketing Series tag on INSIDE for more measurement workflows built on the CI-First approach
The mention you never saw on Tuesday was data. By next Tuesday, it will reach someone who can act on it.
IMPORTANT NOTICE
This lecture is published by University 365 as part of its INSIDE Publications Hub. The content is free to read for all visitors. Lectures in this series may be part of a structured academic program leading to a Micro-Credential for your Career (MCC). To enroll in an academic program, visit university-365.com/tuition.
This content is for educational purposes. While we strive for accuracy, platform access terms and tool pricing change frequently. Verify current legal terms and pricing against primary sources before professional use.
Copyright University 365, Inc. All rights reserved. This content is protected under University 365's copyright policies. For permissions or inquiries, contact uda@university-365.com.
Published by the Department of Academics, University 365.
Lecture delivered by the University 365 Institute of Communication (UIC).
Lea Loringam, Dean of Communication, UIC
Signed for the academic year 2026.




Comments