
Chokepoints: Suez, Hormuz, Malacca

In this Interest


Chokepoints: Suez, Hormuz, Malacca
Snapshot
Three narrow channels carry a large share of what the world burns and buys. The Strait of Malacca links the Indian and Pacific Oceans, the Strait of Hormuz connects the Persian Gulf to the open sea, and the Suez Canal joins the Red Sea to the Mediterranean.
Each is carrying something different in 2026, and each has a different substitute, which is why a closure in one moves prices in a way a closure in another does not.
By the end you will be able to say what each one carries in barrels and cubic feet, what a diversion costs in days and freight rates, and why geography still sits inside the price of ordinary goods.
This brief runs about eleven minutes.

Chokepoints: Suez, Hormuz, Malacca
Why Now
In October 2026 the three are in three different states, and the difference is the story. Suez is recovering. The canal authority counted 1,358 vessels in August 2026 against 1,070 in August 2025, with revenue up 56.7 per cent to 567.1 million dollars and net tonnage up 51.1 per cent. Lloyd's List Intelligence counted 287 transits a week on average over the four weeks to 27 September, against 252 in June.
Hormuz is working around damage. The war that began at the end of February 2026 cut traffic through the strait. September recorded at least 477 non-Iranian-linked transits, the highest since the war began, while bulk and container traffic improved little and at least 13 attacks on tankers or gas carriers were recorded from 28 September.
Malacca has not been closed at all and remains the largest oil chokepoint on the Energy Information Administration's table. What changed is not the geography. What changed is which substitute each route has, and how fast a schedule can move onto it.
Chokepoints: Suez, Hormuz, Malacca
The Explainer
What Each One Carries
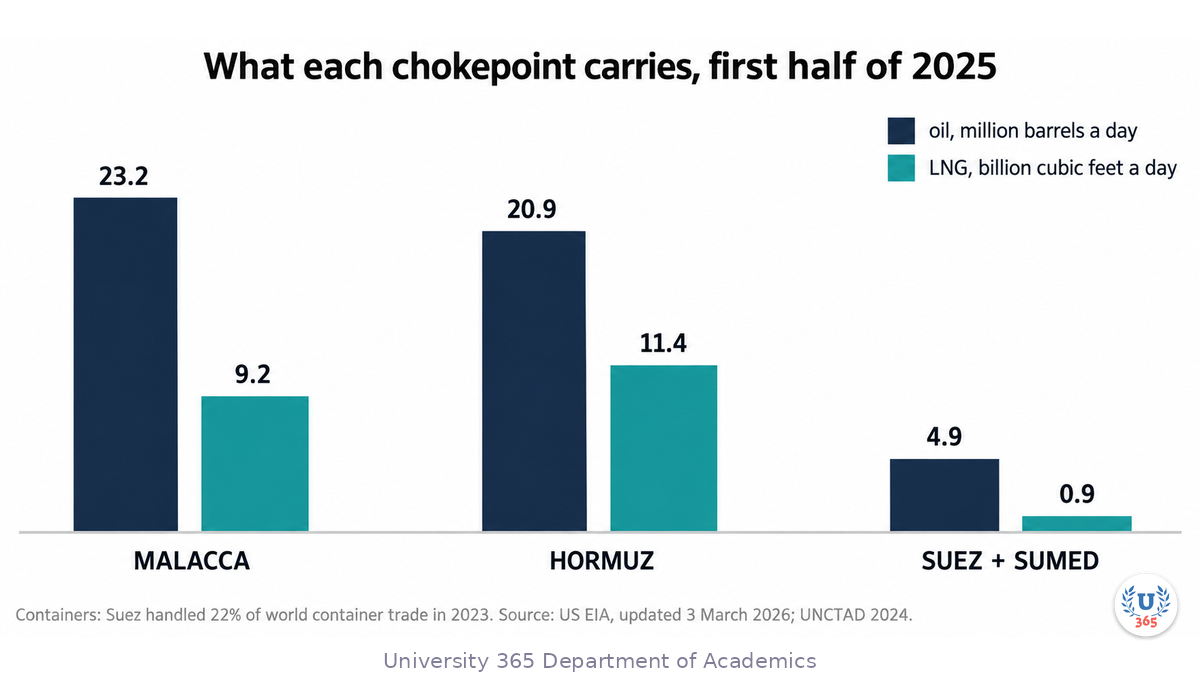
Start with the barrels, because they are measured daily and published with a date. In the first half of 2025 the Strait of Malacca carried 23.2 million barrels of oil a day, the Strait of Hormuz 20.9 million, and the Suez Canal with the SUMED pipeline 4.9 million (Energy Information Administration, World Oil Transit Chokepoints, updated 3 March 2026). Those three figures sit against a world maritime oil trade of 79.8 million barrels a day and a total world oil supply of 104.4 million.
The ranking is not the ranking most people expect. Malacca is first: 29 per cent of all oil moved by sea, and the largest chokepoint in the world on that measure. Hormuz is second at about a fifth of global petroleum liquids consumption and a quarter of seaborne traded oil. Suez, which carries the headlines, is third among the chokepoints on that table, level with the Danish Straits and a little above the Bab el-Mandeb. The canal matters for a different reason, which is containers: 22 per cent of global seaborne container trade transited it in 2023, and container ships were 43 per cent of its gross tonnage (UNCTAD, Navigating Troubled Waters, February 2024).
Gas follows a third pattern. Hormuz carried 11.4 billion cubic feet a day in the first half of 2025, more than a fifth of world LNG trade, most of it from Qatar. Malacca carried 9.2 billion. Suez carried 0.9 billion, down from 4.1 billion in 2023, and LNG through the Bab el-Mandeb was effectively zero. A canal that still carries a fifth of the world's container trade now carries almost no gas.
Why a Narrow Channel Moves a Price
A diversion does not remove a ship from the fleet. It removes the trips that ship could have made. When a vessel takes the long route, the same tonnage delivers fewer cargoes per year, and the world pays for the missing trips. UNCTAD measured the effect in 2024: ton-miles jumped 5.9 per cent, nearly three times the growth in the volume of trade (Review of Maritime Transport 2025). That gap between distance and volume is the whole mechanism.
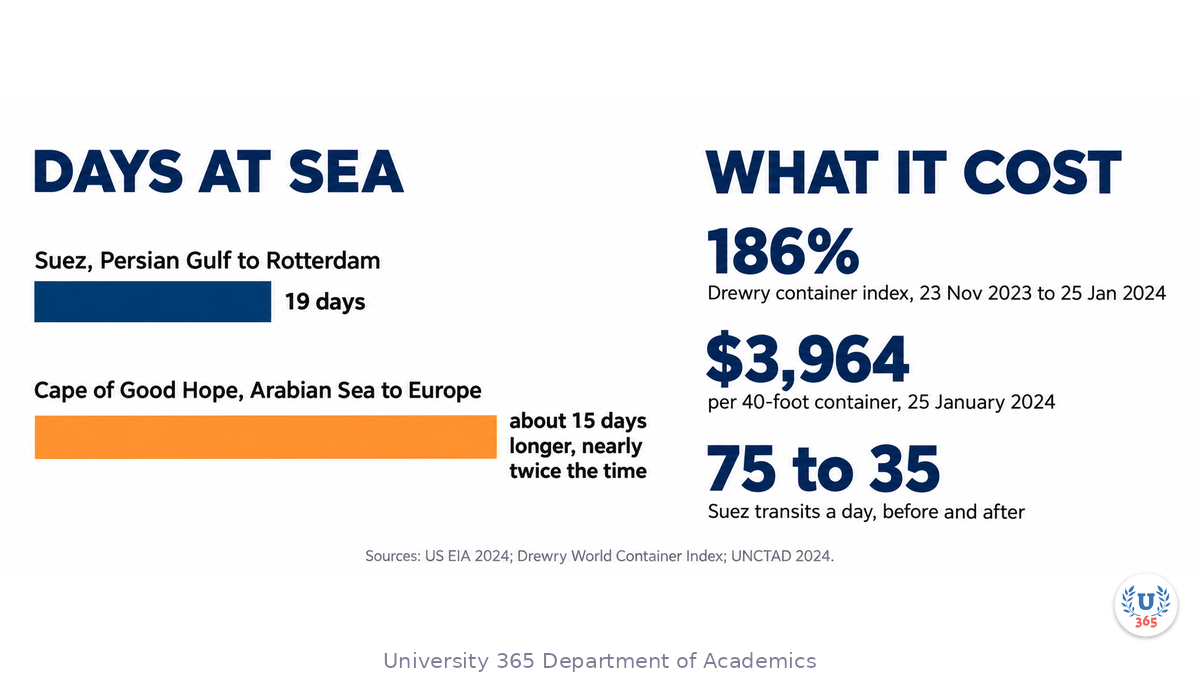
The days are concrete. A voyage from the Persian Gulf to the Amsterdam-Rotterdam-Antwerp hub takes 19 days through Suez (Energy Information Administration, Red Sea attacks increase shipping times, February 2024). Going around the Cape of Good Hope from the Arabian Sea to Europe takes about 15 days longer, nearly twice the time. The International administration describes the extra distance for the Far East to Europe lane as several thousand miles and two to three weeks, depending on the pair of ports.
Rates move further than the days suggest, because a longer voyage also absorbs containers, crews and fuel that were scheduled elsewhere. On the Drewry World Container Index the composite rate went from 1,384 dollars per 40-foot container on 23 November 2023 to 3,964 dollars on 25 January 2024, a rise of 186 per cent and the highest level since October 2022. Insurance moved too. War risk premiums for a Red Sea transit went from under 0.1 per cent of a ship's value to between 0.7 and 1 per cent by early February 2024 (UNCTAD).
Price can move before any water closes. In June 2025, with no blockage of Hormuz, Brent rose from 69 dollars a barrel on 12 June to 74 dollars on 13 June, on tension alone (Energy Information Administration). A chokepoint charges a risk premium for what might happen, not merely for what has already happened.
The Substitutes, and Their Limits
Every chokepoint has an answer on paper. The question is how much of the traffic the answer can take. Hormuz has the least: the Saudi East-West pipeline and the UAE line to Fujairah together could provide about 4.7 million barrels a day of bypass capacity against 20.9 million passing through the strait, and the Energy Information Administration notes that the pipelines do not normally run empty: its 2025 analysis put the capacity actually available in a disruption at about 2.6 million barrels a day, so the spare capacity is smaller than the nameplate. The SUMED pipeline moves 2.5 million barrels a day north through Egypt. Iran's Goreh-Jask line has an effective capacity near 0.3 million.
Suez has no sea substitute at all for an Asia to Europe container service. The alternative is the Cape, which is not a second canal but a longer voyage, and the canal's own dimensions set a second limit. It is 193.30 kilometres long, 24 metres deep and 205 to 225 metres wide at 11 metres of depth, with a maximum draft of 66 feet (Suez Canal Authority). At that draft it can take 100 per cent of the container fleet and 92.7 per cent of the bulk fleet fully loaded, but only 61.2 per cent of the tanker fleet. The canal excludes part of the tanker trade by geometry, before any question of security arises.
Malacca is the most substitutable of the three. The Sunda and Lombok straits offer a way around the Indonesian archipelago, and a pipeline carries crude from Myanmar to southwest China. Both cost time or volume, and neither is used at scale while Malacca stays open. That is why the largest chokepoint by volume has never produced the largest price event.
What the 2023 to 2026 Record Shows
The recent record is a controlled experiment in avoidance. Attacks on commercial shipping in the Red Sea began in November 2023. Oil through Suez and SUMED fell from 8.8 million barrels a day in 2023 to 4.8 million in 2024 and 4.9 million in the first half of 2025. The Bab el-Mandeb fell from 9.3 million to 4.1 and then 4.2. The Cape of Good Hope rose from 6.2 million to 9.3 and then 9.1. The traffic did not disappear. It moved, and it is still moving.
The International Maritime Organization records what the attacks cost in lives as well as time: three seafarers were killed on the Eternity C on 7 July 2025 and one on the MV Minervagracht on 29 September 2025.
Containers moved fastest and furthest. Container tonnage crossing the canal fell 82 per cent by the first half of February 2024, and 621 container ships had rerouted by 18 February (UNCTAD). The canal's tonnage was still about 70 per cent below its 2023 average at the start of May 2025. Revenue tells the same story with a delay: 9.4 billion dollars in 2023, 3.9 billion in 2024, and 4.67 billion in the 2025/26 fiscal year, up 23 per cent on the previous year and still about half the 2023 figure.
In 2026 the pressure moved north. War in the Gulf from late February cut Hormuz, and the recovery has been uneven: crude exports are back to pre-crisis volumes, in the words of Lloyd's List Intelligence, but concentrated on a handful of operators, and workarounds cost far more than they did before. The strait did not close. It became expensive, which for a shipper is nearly the same thing.
Chokepoints: Suez, Hormuz, Malacca
The Feynman Summary
Imagine a factory in Shenzhen filling a container with furniture for a shop in Rotterdam. The ship can go two ways. Through the South China Sea, the Strait of Malacca, the Indian Ocean, the Bab el-Mandeb, the Red Sea, the Suez Canal and the Mediterranean. Or around the bottom of Africa, past the Cape of Good Hope, with no canal and no narrow water at all.
The first way is shorter by several thousand miles and about two to three weeks. The second way is always available, which is why nobody calls the Cape a chokepoint. A chokepoint is a place where the short route is the only route, or nearly so.
When the short route becomes risky, each ship takes the long one. No ship is lost and no cargo is destroyed, yet the world suddenly needs more ships to move the same goods, because each ship spends more days at sea. The freight rate is the price of those missing trips. That is why a strait in the Red Sea and a canal in Egypt raised container rates by 186 per cent, and why an oil market with no actual shortage moved Brent by 5 dollars on a weekend of tension.
The three chokepoints differ in how easily they can be avoided. Malacca has two smaller straits beside it. Suez has only the Cape. Hormuz has pipelines that could carry about a fifth of its oil. The smaller the substitute, the larger the price move when the water is in question.
Chokepoints: Suez, Hormuz, Malacca
The Evidence
Three kinds of record support this brief, and they are not interchangeable. The first is tanker tracking. The Energy Information Administration's chokepoint tables are built on Vortexa tanker tracking and its Short-Term Energy Outlook, with conversion factors published in the notes, and the edition used here was updated on 3 March 2026 with data to the first half of 2025. The strength is that the method is stated and the series is consistent across chokepoints. The limit is the cut-off: the 2026 war in the Gulf is not in those tables.
The second is a transit count. Canal authorities count what they bill, which makes the Suez figures exact for the canal and silent about where the cargo went. The weekly counts in this brief come from Lloyd's List Intelligence, which tracks cargo-carrying vessels over 10,000 deadweight tonnes by AIS and classifies them, and which states that definition in every brief. That count will not match a canal authority's number, because the two are counting different populations.
The third is a modelled estimate. UNCTAD's Review of Maritime Transport draws on Clarksons Research and Marine Benchmark AIS data, and its 5.9 per cent ton-mile figure is an estimate of distance-adjusted demand, not a measurement of any single voyage. The Drewry index used here is a spot rate for specific lanes, not the contract price most shippers pay.
What the evidence does not show is the cost of a closure that never happened. Every figure here comes from a disruption that lasted long enough to be counted. The 2026 Hormuz data are preliminary, published fortnightly, and revised. The honest position is that the direction of every effect is well established and the size of each is uncertain by a margin that no single source states.
Chokepoints: Suez, Hormuz, Malacca
The Counter-Case
The strongest objection is that chokepoints are a smaller part of the price of goods than the attention they receive. Freight is a minor share of the shelf price for most manufactured goods, and the system adapts: within months of the Red Sea attacks, 621 container ships had rerouted and the Cape route was carrying the traffic. On this reading, geography sets a cost that is real, bounded and temporary, and the chokepoint frame turns a logistics problem into a strategic one.
A second objection is about causation. Prices moved on the threat of closure, as Brent did in June 2025 with the strait open, so the chain runs through expectations and insurance rather than through barrels. If that is right, the water matters less than what traders believe about the water, and beliefs can reverse without any ship changing course.
UNCTAD supplies the counterweight. It estimated that about half of the increase in food prices observed in 2022 came from higher transport costs, a combination of longer distances and higher rates. For bulk food and energy, freight is not a rounding error. What would settle the argument is a measured pass-through from a chokepoint event to consumer prices in a specific basket, and a sustained Hormuz closure with observed volumes. Neither is available, so the defensible claim is narrower: chokepoints set the cost of the voyage, and the voyage matters most for the goods you buy by weight.

Chokepoints: Suez, Hormuz, Malacca
What It Means for You
This sits in Quality of Life. The price of what you buy and the reliability of when it arrives are set partly in three stretches of water you will probably never see, and knowing which one is under pressure tells you which prices are likely to move and which are not. It also touches Spirit and Mind in a narrow way: a system you can describe is a system you can reason about instead of react to.
The useful habit is to read a chokepoint headline by asking three questions in order. Which commodity is moving? Which substitute exists? Which series produced the number? A story about container rates through Suez and a story about crude through Hormuz are different stories with different lags, and most coverage mixes them. the Interests method page sets out how this class of brief is built and why the applied AI question is asked of every subject.
Read the commodity first Oil, gas and containers use different ships, different substitutes and different indices, so a headline about one tells you little about the other two.
Name the series Canal authority counts are monthly and billed, AIS counts are weekly and estimated, and freight indices are spot, so check which one a claim rests on before you accept its direction.
Watch the substitute The Saudi East-West pipeline, the Cape of Good Hope and the Lombok Strait are the real answers to a closure, and their spare capacity is the number that decides the price.
The Applied AI Connection
The counts in this brief are not census data. The Energy Information Administration builds its chokepoint tables on Vortexa tanker tracking, and the weekly transit counts come from the Lloyd's List Intelligence Red Sea and Strait of Hormuz monitors, which read satellite AIS positions and apply automated classification to decide what each vessel is, where it is going, and whether a gap in its transmission is a fault or a choice. The task that changes is measurement. A canal authority bills what passes its toll booth and publishes monthly. An AIS system counts the same water daily and can flag a tanker that goes dark beside a terminal under sanctions.
For you, the practical difference is knowing which number you are reading. An authority count is exact for the canal and silent about where the cargo went. An AIS count is daily, estimated, published with a lag of days, and sensitive to how dark transits are classified. Ask which one a headline rests on before you accept the direction of travel it claims. The classification models are proprietary and not published, so treat a vendor count as an estimate with a method, not as a fact.
Chokepoints: Suez, Hormuz, Malacca
The Five-Minute Version
Three narrow waters, three different jobs. Malacca carries the most oil of any chokepoint on earth, 23.2 million barrels a day in the first half of 2025, because it is the shortest sea route from the Gulf to East Asia. Hormuz carries 20.9 million barrels a day, about a fifth of the world's petroleum liquids consumption and more than a fifth of its liquefied natural gas, with the least spare pipeline capacity of the three. Suez carries 4.9 million barrels a day with the SUMED pipeline, which is modest, and 22 per cent of the world's container trade, which is not.
A closure does not destroy cargo. It lengthens voyages, and longer voyages consume the fleet. Ton-miles rose 5.9 per cent in 2024, nearly three times the growth in trade volume, and that gap is the price increase. The Cape of Good Hope route adds two to three weeks and several thousand miles, which is the span the administration gives for the Far East to Europe lane. Container rates went from 1,384 dollars per 40-foot container on 23 November 2023 to 3,964 dollars on 25 January 2024.
The substitutes decide the damage. Hormuz has pipelines for perhaps 4.7 million of its 20.9 million barrels a day. Suez has only the Cape. Malacca has two smaller straits and a pipeline, which is why the largest chokepoint by volume has not produced the largest price event.
The caveat is measurement. Authority counts, AIS counts and freight indices measure different populations, and a number quoted without its series is not evidence. The record from 2023 to 2026 shows the system rerouting, slowly and at a cost, and it shows that cost landing hardest on goods bought by weight: food, fuel and bulk materials.

Chokepoints: Suez, Hormuz, Malacca
Sources
All sources below were opened and read on 20 October 2026.
Energy Information Administration, World Oil Transit Chokepoints (updated 3 March 2026) US Energy Information Administration, World Oil Transit Chokepoints (updated 3 March 2026)
Energy Information Administration, Strait of Hormuz analysis (16 June 2025) US Energy Information Administration, Amid regional conflict, the Strait of Hormuz remains critical oil chokepoint (16 June 2025)
Energy Information Administration, Red Sea shipping times (1 February 2024) US Energy Information Administration, Red Sea attacks increase shipping times and freight rates (1 February 2024)
Energy Information Administration, Malacca geography (11 August 2017) US Energy Information Administration, The Strait of Malacca, a key oil trade chokepoint (11 August 2017)
UNCTAD, Review of Maritime Transport 2025 UNCTAD, Review of Maritime Transport 2025
UNCTAD, Navigating Troubled Waters (February 2024) UNCTAD, Navigating Troubled Waters: impact to global trade of disruption of shipping routes (February 2024)
Suez Canal Authority, Canal Characteristics Suez Canal Authority, Canal Characteristics
Suez Canal Authority, Navigation Statistics Suez Canal Authority, Navigation Statistics
Lloyd's List Intelligence, Red Sea Brief (1 October 2026) Lloyd's List Intelligence, Red Sea Brief (1 October 2026)
Lloyd's List Intelligence, Strait of Hormuz Brief (12 October 2026) Lloyd's List Intelligence, Strait of Hormuz Brief (12 October 2026)
Energy Information Administration, longer routes (5 June 2024) US Energy Information Administration, Longer maritime routes mean more fuel consumed in shipping (5 June 2024)
FreightWaves, Suez transits in August 2026 FreightWaves, New data shows Suez route transits rose 27 per cent in August (September 2026)
International Maritime Organization, Red Sea area International Maritime Organization, Red Sea area incident record (accessed 20 October 2026)
Drewry World Container Index via FTA and APSA (January 2024) FTA and APSA, Monthly Shipping Report, January 2024, citing the Drewry World Container Index
Hellenic Shipping News, Drewry index at 3,964 dollars (27 January 2024) Hellenic Shipping News, Drewry: World Container Index up 5 per cent (27 January 2024)
Egyptian Streets, Suez Canal revenue (30 June 2026) Egyptian Streets, Suez Canal revenue rises 23 percent in the 2025/2026 fiscal year (30 June 2026)




Comments