
The Grid: How Electricity Stays Balanced

In this Interest


The Grid: How Electricity Stays Balanced
Snapshot
An electricity grid is a machine that keeps two numbers equal in real time: the power fed in and the power taken out. Alternating current stores almost nothing, so the balance is held continuously rather than settled at the end of a day.
The instrument that shows the balance is frequency, and it is drifting all the time.
By the end you will be able to say why 50 Hz is a statement about every generator at once, which reserve responds in the first seconds, and why the largest European blackout in twenty years was not the failure most people assume.
This brief runs about ten minutes.

The Grid: How Electricity Stays Balanced
Why Now
On 20 March 2026 the Expert Panel appointed under Commission Regulation (EU) 2017/1485 published its final report on the blackout that took out continental Spain and Portugal on 28 April 2025. It classified the event at scale 3, the highest severity in the incident scale, and called it the most severe blackout in Europe in twenty years.
The finding that matters here is what did not cause it. The report traces the collapse to an uncontrolled, rapid rise in system voltage, loss of voltage control, differences in voltage regulation practice and cascading generator disconnections. On frequency it is explicit: simulation showed that even with significantly higher inertia the loss of synchronism would not have been avoided, because synchronising torque collapsed faster than any frequency response could act.
Storage has grown quickly at the same time. The International Energy Agency recorded 42 GW of battery storage added worldwide in 2023, more than double the year before, taking installed capacity above 85 GW, with prices down about 90 per cent since 2010 to under 140 dollars per kilowatt hour. The plant mix changed. The physics of holding 50 Hz did not.
The Grid: How Electricity Stays Balanced
The Explainer
Frequency Is a Shared Speed
Every synchronous generator on the same interconnection turns in step. A two pole machine at 50 Hz completes 3,000 revolutions a minute, and every other machine holds the same angle relative to its neighbours. Frequency is not a property of one plant. It is the common speed of the whole rotating fleet.
When mechanical power into the generators exceeds electrical power leaving them, the surplus accelerates that mass and frequency rises. When load exceeds generation, the deficit decelerates it. The mass is the buffer, and it is measured as stored kinetic energy: the inertia constant H states how many seconds of its own rated load the system's kinetic energy would supply.
The Expert Panel measured that quantity for the Iberian system at 12:30 on 28 April 2025. Spain held 97,590 MWs, Portugal 21,884 MWs, and the peninsula 119,474 MWs, about 119 gigajoules, an inertia constant of 2.21 to 2.71 seconds. The range exists because the contribution of motors in industry and homes cannot be counted precisely.
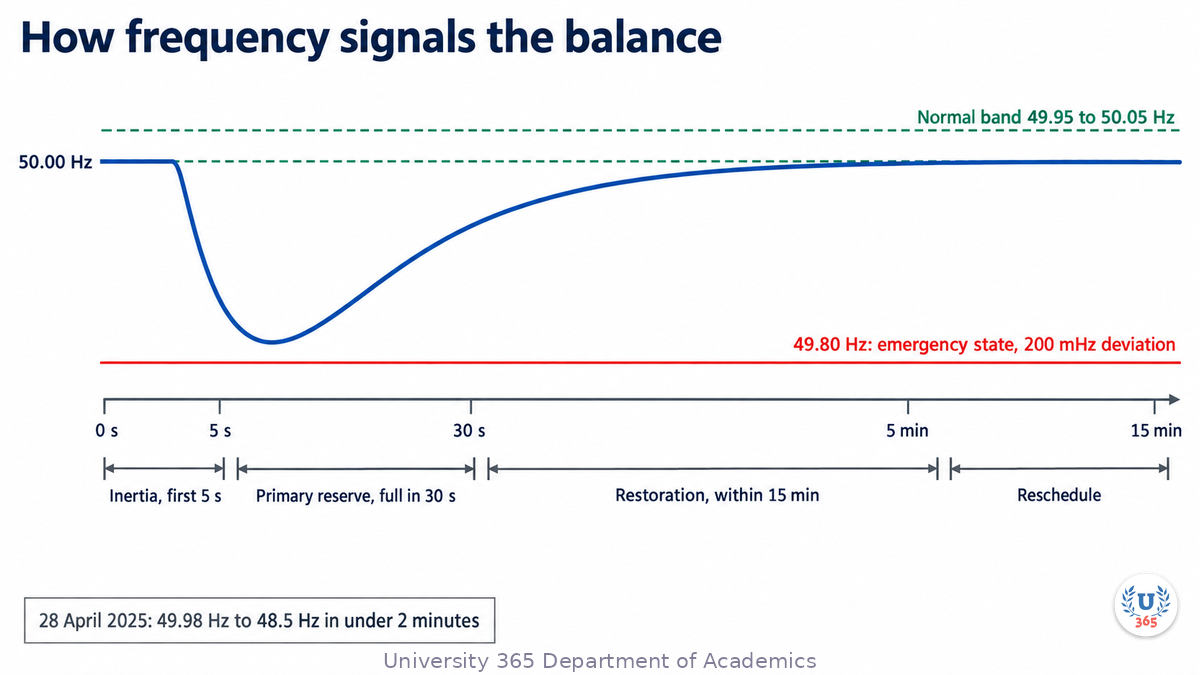
Timing decides which defence acts. Milano, Dorfler, Hug, Hill and Verbic set out the sequence in their 2018 survey: rotating mass dominates the first seconds, typically up to five, primary control acts over tens of seconds, secondary control over minutes, and tertiary control over tens of minutes to hours.
The Three Reserves
The first tier is frequency containment, or primary reserve. Governors respond to the deviation automatically and locally, without a control room instruction. NERC gives the two parameters that decide a unit's contribution: droop, typically 5 per cent, and deadband, the threshold below which the governor does nothing. In Continental Europe the requirement is quantitative: at a deviation of 200 mHz or more, full capacity must be delivered at the latest after 30 seconds.
The second tier restores frequency and unwinds the interchange error that built up while the first tier worked. It has an automatic part that follows a control signal and a manual part the operator instructs. The European guideline sets the time to restore frequency at 15 minutes, and a third tier replaces the secondary reserve so the system is ready for the next event.
The size of the problem depends on the system, and NERC publishes the numbers. A loss of 1,000 MW moves frequency by about 0.048 Hz in the Eastern Interconnection, 0.065 Hz in the Western, 0.148 Hz in Texas and 0.168 Hz in Quebec. Those follow each interconnection's frequency bias, from minus 2,103 MW per 0.1 Hz in the East to minus 599 MW per 0.1 Hz in Quebec, measured from before the event to the stabilizing point about 20 to 52 seconds later. The same 1,000 MW is three and a half times more disruptive in the smallest of those systems than in the largest.
The bands are equally concrete. Article 127 of the European guideline fixes nominal frequency at 50 Hz. The Continental Europe policy adds that plus or minus 50 mHz is not to be exceeded for more than 15,000 minutes a year, and that a deviation beyond 200 mHz puts the synchronous area into emergency state. A grid that looks stable on a dashboard is being corrected thousands of times a day.
The Order in Which Plants Are Called
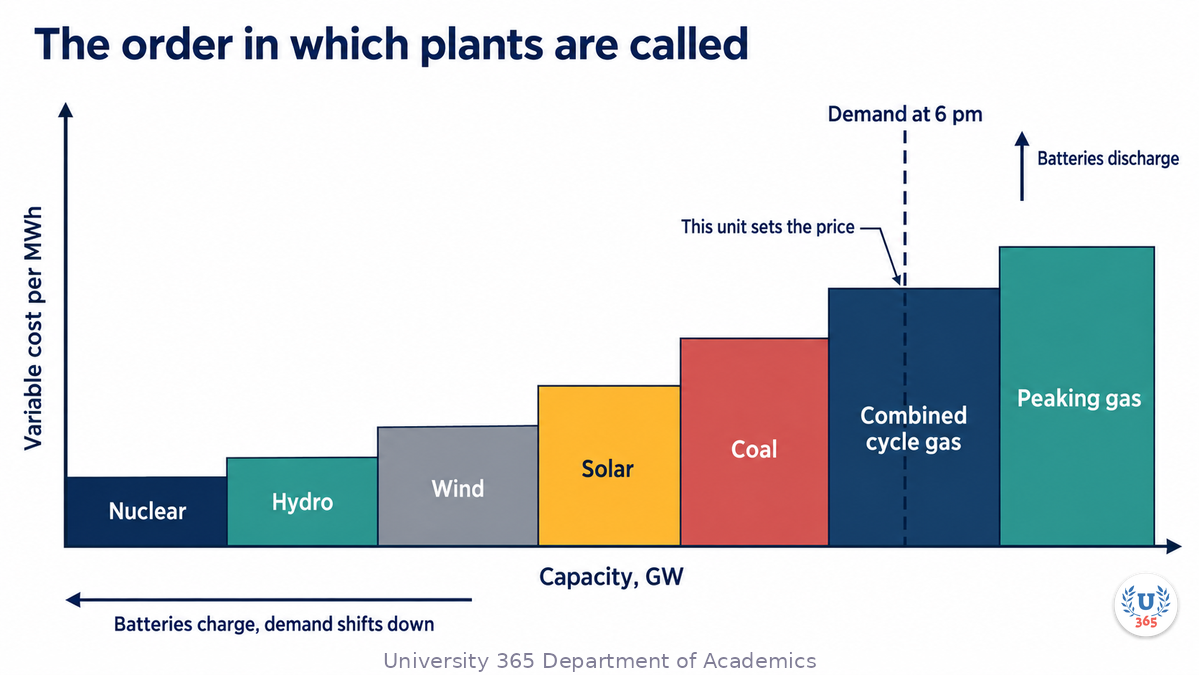
Dispatch is decided on cost. The US Energy Information Administration describes the sequence: plants with the lowest variable operating costs are dispatched first, and higher cost plants are brought on as demand rises. On the resulting curve, nuclear, hydroelectric, wind and solar sit at the left because their variable cost is lowest, and gas peaking units sit at the right because theirs is highest. A vertical line drawn at the demand for that hour crosses the curve at one unit, and that unit sets the price.
Two features cause the difficulty. Wind and solar have almost no variable cost, so they are taken first whenever the resource is available, and the operator schedules around a supply it does not control. The curve is also a plan for an hour, not a control system for a second, which is why the reserves exist.
Storage and demand response enter the same curve from both directions. A battery charges when power is cheap, which makes it a load, and discharges when power is expensive, which makes it a generator. The International Energy Agency notes that batteries respond to market signals in a matter of seconds and can run for one to eight hours continuously.
What a Large Renewable Share Changes
Inverter connected resources change the first seconds rather than the first minutes. The Expert Panel states the mechanism plainly: batteries, wind and photovoltaic systems do not contribute to system inertia, while thermal solar and some other renewable sources have a non zero inertia constant. Replace a coal unit with a solar farm of the same rating and the same megawatt can be delivered, but the rotating mass that resisted a frequency change is gone.
The measurable consequence is the rate of change of frequency. In the Iberian event it stayed inside an absolute 1 Hz per second until 12:33:20.560, when frequency was about 49 Hz; after that it exceeded 1 Hz per second, which the panel reads as degraded conditions. A faster rate is harder on protection settings and leaves less time for any control loop to act.
Inverters can be controlled to supply a response anyway. Milano and his co-authors describe the requirement: a converter needs energy storage on its direct current side and a control loop that reacts to frequency or to its rate of change, which is what virtual inertia means in practice. It is a control feature, not a property of the hardware, so it has to be specified and paid for.
That is why the constraint shows up as a procurement number. NESO reduced its inertia requirement from 140 GVA.s to 120 GVA.s during 2024/25, which means fewer machines run for stability alone, and saved about 122 million pounds since February 2024. Its first stability market, for delivery from October 2025, procured 5 GVA.s of inertia from five providers. Inertia became a service with a price and a contract.
The Grid: How Electricity Stays Balanced
The Feynman Summary
Think of the grid as one set of machines joined by a shaft that is not there. Every generator on an interconnection turns at the same speed, and that speed is what frequency measures. If the country consumes more than it generates, the extra demand slows the machines and frequency drops; if it generates more than it consumes, they speed up.
The first defence is weight. Heavy rotating parts store energy, so a small mismatch changes their speed slowly. That stored energy buys seconds, not minutes, and it exists only while synchronous machines are connected. The second defence is control: governors push more power in when they feel the speed drop, and they must deliver their full contribution within thirty seconds. The third is the operator, who instructs more plant or less demand and brings frequency back within a quarter of an hour.
Everything else is bookkeeping around those three. The market ranks plant by variable cost, storage moves energy between cheap and expensive hours, and the operator holds reserve because the plan is never exact. The 2025 blackout in Spain and Portugal is the useful warning: the machines lost voltage control and disconnected in cascade, and the report says more rotating mass would not have saved them. Balance is necessary. It is not sufficient.
The Grid: How Electricity Stays Balanced
The Evidence
The rules are written down. Commission Regulation (EU) 2017/1485 fixes nominal frequency at 50 Hz in Article 127 and lists the quality parameters in Annex III. The Continental Europe policy states the operating consequences: plus or minus 50 mHz is the band that may be exceeded for no more than 15,000 minutes a year, a deviation beyond 200 mHz is an emergency state, and full FCR capacity is due within 30 seconds at that deviation. These are legal requirements, not best practice.
The measurements come from operators. NERC's 2021 reference document reports the frequency response of four North American interconnections, from minus 2,103 MW per 0.1 Hz in the East to minus 599 MW per 0.1 Hz in Quebec, and translates each into the frequency change caused by a 1,000 MW loss. Those figures are drawn from the 2018 State of Reliability and are explicitly not normalized for starting frequency or for the size of the loss, so they are orders of magnitude rather than predictions.
The Iberian case is documented to the second: about 50 Hz before 12:32, then 49.94 Hz after a 355 MW disconnection at 12:32:57, 49.8 Hz after at least 930 MW at 12:33:17, and 48.5 Hz before 12:33:20, when the peninsula separated from continental Europe.
The limits are worth stating. The inertia constant is a range because load inertia cannot be measured directly. The NERC figures are historical averages, not a controlled experiment. The blackout was a voltage and synchronism event, so it does not show that frequency control failed, and the storage response claim comes from a market survey rather than an instrumented test.
The Grid: How Electricity Stays Balanced
The Counter-Case
The strongest objection is that the low inertia story is oversold. On this reading, the claim that renewables make grids fragile borrows a real fact and attaches it to a conclusion the evidence does not support. The Expert Panel tested that proposition for the largest European blackout in twenty years and found that even significantly higher inertia would not have prevented the loss of synchronism, because cascading disconnections removed synchronising torque faster than any frequency response could compensate.
The second half of the objection is economic. Britain reduced its inertia requirement by 20 GVA.s and saved about 122 million pounds in a single year, and it bought 5 GVA.s from five providers in a market. If inertia were a hard wall, that reduction would not have been available. The constraint is real, but it moves with protection settings, control specifications and procurement.
What would settle it is a frequency event in a low inertia system where load shedding triggered on the rate of change, with inertia measured at the time and a documented counterfactual at higher inertia. The Iberian report supplies the counterfactual and it points the other way. No public dataset yet pairs that with a year of event data at markedly lower inertia, so the physics is settled, the threshold is not, and the 2025 event does not support the simplest version of the story.

The Grid: How Electricity Stays Balanced
What It Means for You
This sits in Quality of Life, with a second edge in Career and Finance. Reliability is a service someone buys every half hour, and its price appears on your bill: NESO puts balancing charges at about 3.4 per cent of a domestic electricity bill, roughly 3 pounds a month for a typical household. When an operator says it has reduced an inertia requirement or moved demand response into the merit order, it is describing a change in what your supply costs.
The practical consequence is that flexibility now has a price, and you may own some of it. A battery, a controllable hot water tank, a vehicle that charges overnight and a generator with a tested transfer switch all change what you can do when the system is tight. the Interests method page sets out how this class of brief is built and why the applied AI question is asked of every subject.
Read the constraint, not the headline When a grid warning appears, distinguish a capacity warning from a voltage or stability warning, because the first is about enough generation and the second is about the network holding together.
Time what you can time If you charge a vehicle or run a heat pump, check whether your supplier offers a time of use tariff, because shifting load to cheap hours is what the operator now buys from batteries.
Test the backup you rely on Run the transfer switch on any standby supply once a year, because a generator that starts and does not take load is a false sense of security.
The Applied AI Connection
The task that artificial intelligence changed first on this system is the day ahead commitment, not the control room. In February 2019 Google DeepMind and Google described a neural network trained on public weather forecasts and turbine history for 700 megawatts of wind capacity in the central United States. It predicted wind output 36 hours ahead and recommended the hourly delivery commitments to make a day in advance. Google reported that the practice raised the value of that wind energy by roughly 20 per cent against a baseline with no time based commitments. A generator that commits to a number it can meet leaves less imbalance for the operator to cover with reserve.
That evidence is a company blog post, self reported, seven years old and not peer reviewed, so treat the 20 per cent as an internal estimate. What generalises is the shape of the problem. Reserve is bought against forecast error, so an hour of better forecast is an hour of reserve that does not have to be held. When a supplier offers you a forecast, ask what error it achieved, against what baseline, and whether the scoring used data the model had not seen.
The Grid: How Electricity Stays Balanced
The Five-Minute Version
A grid holds supply equal to demand every second, and frequency is how it knows. Every generator on an interconnection turns at the same speed, so a shortfall slows the whole fleet and a surplus speeds it up. At 50 Hz a two pole machine completes 3,000 revolutions a minute, and there is no meaningful storage in the wires.
Three layers of response follow. Inertia is the stored energy in rotating mass, and it acts in the first five seconds. Primary reserve is automatic and local, and in Continental Europe it must deliver full capacity within 30 seconds at a 200 mHz deviation. Restoration is automatic and manual, and the guideline allows 15 minutes to bring frequency back. Everything above that is rescheduling.
The numbers that make this concrete are small. A 1,000 MW loss moves frequency by 0.048 Hz in the Eastern Interconnection and 0.168 Hz in Quebec, so the same event is three and a half times more serious in the smaller system. On 28 April 2025 the Iberian system held 119,474 MWs of kinetic energy and frequency fell from about 50 Hz to 48.5 Hz in under two minutes.
The caveat is the part most retellings omit. The panel that investigated that blackout found the cause in voltage control and cascading disconnections, and concluded that higher inertia would not have prevented the collapse. Inertia matters, and Britain now buys it as a service at a price it chooses.

The Grid: How Electricity Stays Balanced
Sources
All sources below were opened and read on 20 October 2026.
Iberian final report ENTSO-E Expert Panel, Grid Incident in Spain and Portugal on 28 April 2025, Final Report (20 March 2026)
NERC reference document NERC, Balancing and Frequency Control (11 May 2021)
Continental Europe policy ENTSO-E, Synchronous Area Framework Agreement for Regional Group Continental Europe, Annex 1: Policy on Load-Frequency Control and Reserves
System operation guideline Commission Regulation (EU) 2017/1485, Article 127 and Annex III (2 August 2017)
IEA batteries International Energy Agency, Batteries and Secure Energy Transitions (2024)
NESO balancing costs NESO, 2025 Annual Balancing Costs Report (June 2025)
Low inertia survey Milano, Dorfler, Hug, Hill and Verbic, Foundations and Challenges of Low-Inertia Systems (PSCC 2018)
Wind forecasting Google DeepMind, Machine learning can boost the value of wind energy (26 February 2019)




Comments