
The Story of the Barcode

In this Interest


The Story of the Barcode
Snapshot
A barcode is a printed pattern that carries a number a machine can read without anyone typing it. The pattern is cheap and replaceable. The number is the asset.
On 26 June 1974 a supermarket in Troy, Ohio scanned a ten-pack of chewing gum at 67 cents, and the checkout stopped being a typing job.
By the end you will be able to say what the bars encode, why the twelfth digit exists, and what the migration to 2D codes changes by 2027.
This brief runs about twelve minutes.

The Story of the Barcode
Why Now
The standard is moving while staying in place. GS1's retail implementation guideline sets the industry target: by the end of 2027, point-of-sale scanners worldwide should read the GTIN from a 2D barcode as well as from the linear one. The linear barcode is not switched off, and during the transition a pack carries both.
The rulebook moved too. GS1 General Specifications Release 26.0, ratified in January 2026, adds EPC/RFID and NFC as additional data carriers for the extended packaging application standard. A document that once described one printed symbol now describes several carriers for the same identifier.
What changed is capacity: a 2D carrier can hold a batch number, an expiry date, a serial number and a web address. What did not change is the key inside it, which remains the GTIN.
The Story of the Barcode
The Explainer
A queue, a committee and two symbols
The barcode did not start as a technology looking for a use. It started with a supermarket manager who asked a dean at Drexel Institute of Technology for a way to move shoppers through his store faster and to stop counting stock by hand. A postgraduate, Bernard Silver, overheard him in 1948 and told Joseph Woodland, who left graduate school that winter. In January 1949, on a beach in Miami, Woodland pushed four fingers into the sand and pulled them toward him: Morse code gave him wide lines and narrow lines in place of dots and dashes. He and Silver filed a patent in 1949, granted in 1952, for a bullseye of concentric circles readable from any angle.
Industry took two decades to act. In 1966 Kroger printed a booklet that ended with a wish for an optical scanner at the checkout, and RCA installed automated checkstands at a Kroger store in Cincinnati on 3 July 1972. In 1970 the grocery trade had set up an Ad Hoc Committee, organised by McKinsey, to choose one code for every product in every store. Seven companies submitted systems. The symbol committee asked the Massachusetts Institute of Technology for an appraisal, and on 30 March 1973, in a New York hotel near Grand Central Station, its chair Alan Haberman asked each member how confident they were. Confidence ran at about 90 per cent, and the winner was a rectangular code from IBM, drawn by George Laurer.
Laurer had a specification before he drew anything: no more than 1.5 square inches, printable with existing label technology, ten digits of data, readable from any direction and at speed, with fewer than one undetected error in 20,000 scans. IBM dates the Universal Product Code to 1 April 1973. Fifteen months later, Clyde Dawson of Marsh chose a ten-pack of Wrigley's chewing gum for the first scan because nobody had been sure a code could be printed that small, and Sharon Buchanan read it just after eight in the morning at 67 cents.
What the bars encode
Every digit in a UPC-A is a character seven modules wide, built from four elements: two dark bars and two light spaces, each one to four modules wide. The pattern for a digit is chosen so that its number of dark modules is either odd or even, which is how the decoder tells the left half of the symbol from the right half and recognises a symbol read upside down.
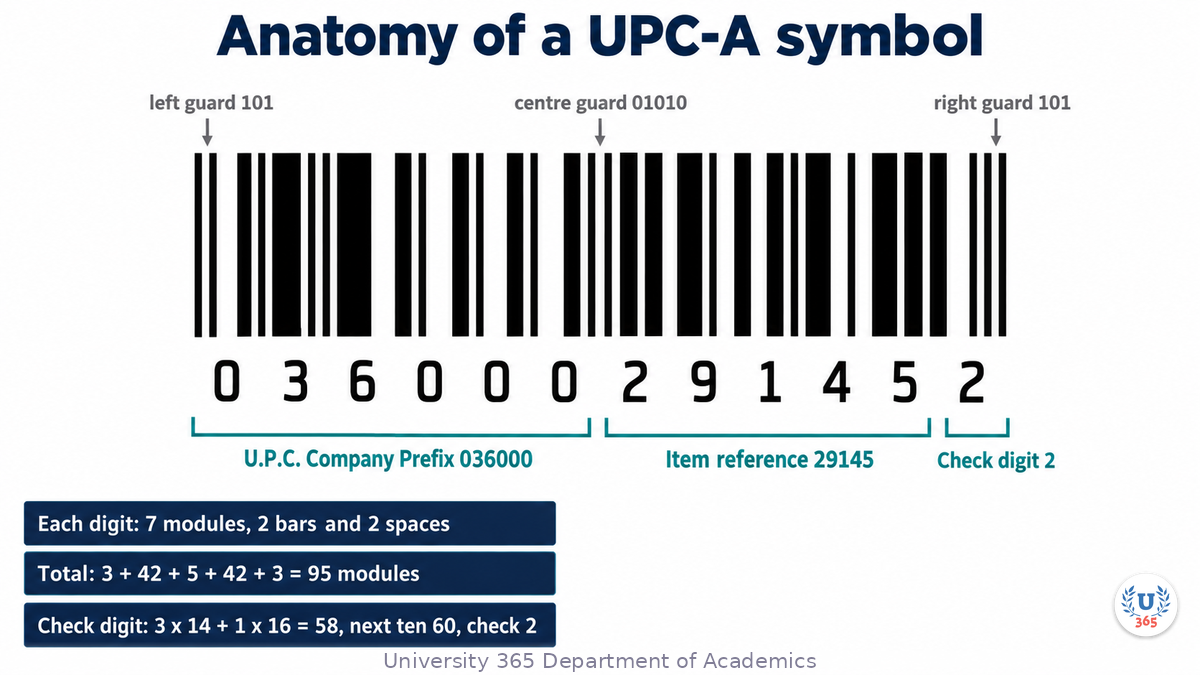
A UPC-A carries twelve digits between two guard patterns and a centre guard: a quiet zone nine modules wide, a three-module guard (101), six digits in the odd parity set, a five-module centre guard (01010), six digits in the even parity set, a second three-module guard, a second quiet zone. That is 95 modules of bars and spaces, 18 modules of white either side, 113 in total.
The size is set by one number, the X-dimension, the width of a single module. GS1 gives a minimum of 0.264 millimetres, a target of 0.330 and a maximum of 0.660, with a bar height of 22.85 millimetres at nominal size. At the target the whole symbol measures 37.29 millimetres with the quiet zones.
The twelve digits, and the digit that catches errors
The twelve digits are a GTIN-12: a U.P.C. Company Prefix, an item reference and a check digit. The prefix is licensed and its length varies, so the boundary between prefix and item reference is not fixed at five and five.
The check digit catches mistakes. Number the eleven data digits from the left, multiply the digits in odd positions by three, add the even positions, and subtract the total from the next multiple of ten. Take 0 3 6 0 0 0 2 9 1 4 5. The odd positions carry 0, 6, 0, 2, 1 and 5, which sum to 14 and count as 42; the even positions carry 3, 0, 0, 9 and 4, which sum to 16. The total is 58, the next multiple of ten is 60, and the check digit is 2. A misread element usually fails this test, which is why a damaged symbol refuses rather than reading the wrong product.
One number, many carriers
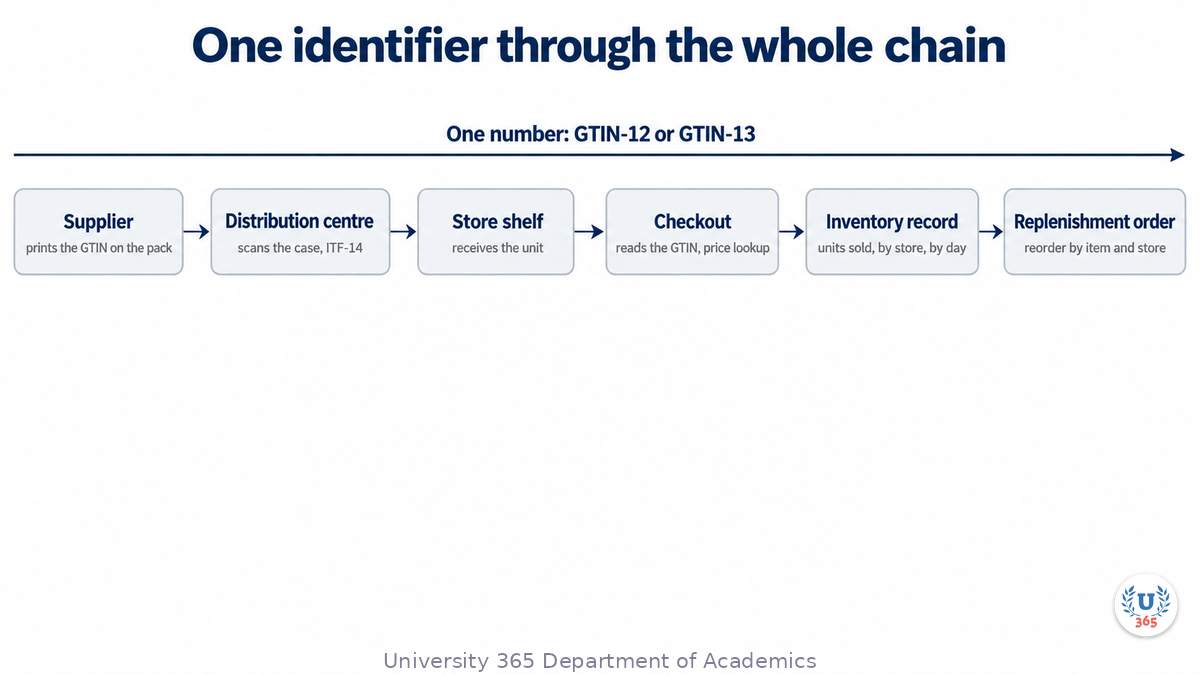
A GTIN identifies a product, not a unit. The same digits appear on every pack of that product, in every store, in every country, so a scan at one till writes into the same item record a warehouse in another country reads. GTIN-8 fits small packs, GTIN-12 is what a UPC-A carries, GTIN-13 is what an EAN-13 carries, and GTIN-14 identifies a case or pallet, which is why an ITF-14 barcode is printed on corrugated cases rather than on the pack the shopper buys.
GS1 also allows Application Identifiers beside the number: (01) for the GTIN, (10) for a batch, (17) for an expiry date, (21) for a serial. A GS1-128 or GS1 DataMatrix symbol carries them. A UPC-A cannot, because twelve digits and a check digit is all the room it has.
Where the symbol goes next
GS1 names three 2D carriers for the retail point of sale: GS1 DataMatrix, a QR Code carrying a GS1 Digital Link URI, and a Data Matrix carrying the same link syntax. A Digital Link is a web address with the number inside it, so one symbol can serve the scanner at the till and a phone in a shopper's hand.
The guideline is careful about the claim. The target is that scanners read and process the GTIN from both kinds of symbol by the end of 2027, not that linear barcodes disappear. It warns that some scanners in service cannot read 2D, and that some sites will need new hardware. Healthcare moved to 2D earlier and settled on GS1 DataMatrix alone.
The Story of the Barcode
The Feynman Summary
Here is the whole thing without the vocabulary. A barcode writes a number in stripes so a machine can read it. The machine shines light across the stripes, measures how wide each bar and each gap is, and turns those widths back into digits. Each digit is seven units wide, made of two bars and two gaps, and the pattern tells the machine whether it is reading the left half or the right half.
The number those digits spell is the product number, and it does not contain the price. When the till reads it, the till looks the price up in its own file, which is why a price can change without anyone relabelling the shelf.
The last digit is not information about the product. It is a sum of the other eleven, and the scanner recomputes it every time. If the sum does not match, the scanner refuses the read, so a scratched or badly printed code makes the till beep instead of charging you for something else.
The number is the part that lasted. The stripes are one way of writing it down, and by 2027 the same number will arrive in a square code that can also carry a batch and an expiry date.
The Story of the Barcode
The Evidence
The best evidence on whether the barcode paid comes from Emek Basker, who matched store-level data from the 1972, 1977 and 1982 Censuses of Retail Trade to records of which stores had installed scanners. Her estimate, published in the American Economic Journal: Applied Economics in July 2012, is that scanners raised a store's labour productivity by about 4.5 per cent in the first few years. The effect was not uniform: a store that drew little revenue from packaged goods gained about 1.4 per cent, while one that drew 70 per cent from packaged groceries gained 5.7 per cent. She also priced the network at about 28 dollars a year per store for one more barcoded product.
That number explains the slow start. About a third of American supermarkets had scanners within ten years, because a scanner only pays when products carry codes and products only get codes when enough stores scan them. Basker concludes that the early scanners probably did not return their cost, so the barrier was profitability rather than coordination.
On the data side, the most detailed published comparison of item-level capture is Project Zipper, a one-year study run by the Auburn University RFID Lab with GS1 US between June 2017 and July 2018, covering eight brand owners and five retailers. Where RFID was used to reconcile shipments, order accuracy reached 99.9 per cent. Where it was not, 69 per cent of inbound orders contained errors. The same lab reports that Exact Match, the share of stock-keeping units whose counted units equal the recorded units, typically falls between 55 and 65 per cent.
The limits are real. Basker measures supermarket labour productivity in the 1970s, and her data cannot separate the scanner from the store systems installed with it. Project Zipper studied RFID, not the printed barcode, so it shows what item-level data is worth, not what the stripes are worth. Neither source tells you what a 2D code will earn.
The Story of the Barcode
The Counter-Case
The strongest objection is that this brief gives the symbol credit for the number. A barcode is a carrier. The GTIN is the asset, and it would work on a QR code or an RFID inlay. On that reading the invention was 1973, the year the industry agreed to one number for every product; 1974 only taught the number to be read quickly. The 2027 migration supports the objection: the same GTIN moves to a different carrier with no change to the number itself.
A second objection is that the productivity gain arrived slowly and depended on things the barcode did not supply. A scanner with no item file and no trained staff is a keyboard with extra steps, and Basker's cost finding says the early installers lost money.
A third objection concerns what the bars cannot say. A UPC-A identifies a class of product, not a unit: no batch, no expiry, no serial number, no location. Every claim about traceability at item level is a claim about RFID or 2D, and attributing it to the printed barcode borrows credit the symbol never had.
What would settle it is what the 2D code carries at the till. If it arrives with a batch and an expiry date that change how a recall is run, the carrier mattered. If it arrives with the same GTIN and the same price lookup in a larger square, the number was the whole story.

The Story of the Barcode
What It Means for You
This sits in Career and Finance, because a GTIN is a licence and a record rather than a piece of graphic design. If you sell a product, you need a number from your national GS1 member organisation, and the prefix is licensed rather than owned, with terms and fees set locally. You may not invent digits, and you may not reuse a number from a product you have discontinued. Reuse is the expensive mistake: two products sharing one key produce a recall you cannot isolate or a listing you cannot correct.
The reading skill is to separate the price from the pack. Since 1974 the pack has carried no price, and the till looks it up in a file. So when a shelf label and a receipt disagree, the file is wrong rather than the barcode, and the fix belongs to whoever maintains the item master. the Interests method page sets out how this class of brief is built, including the test applied to the applied AI question.
Check the digit before the print run Recompute the check digit from the eleven data digits and confirm that the scanner reads the symbol on the first pass, because a symbol that fails the check is a printing fault rather than a scanner fault.
One number per sellable variant A different size, flavour or pack count is a different GTIN, and a discontinued number is never reissued to a new product.
Decide what your 2D code will carry Before 2027, choose whether the new symbol carries only the GTIN or also a batch and an expiry date, because that choice decides which of your systems has to change.
The Applied AI Connection
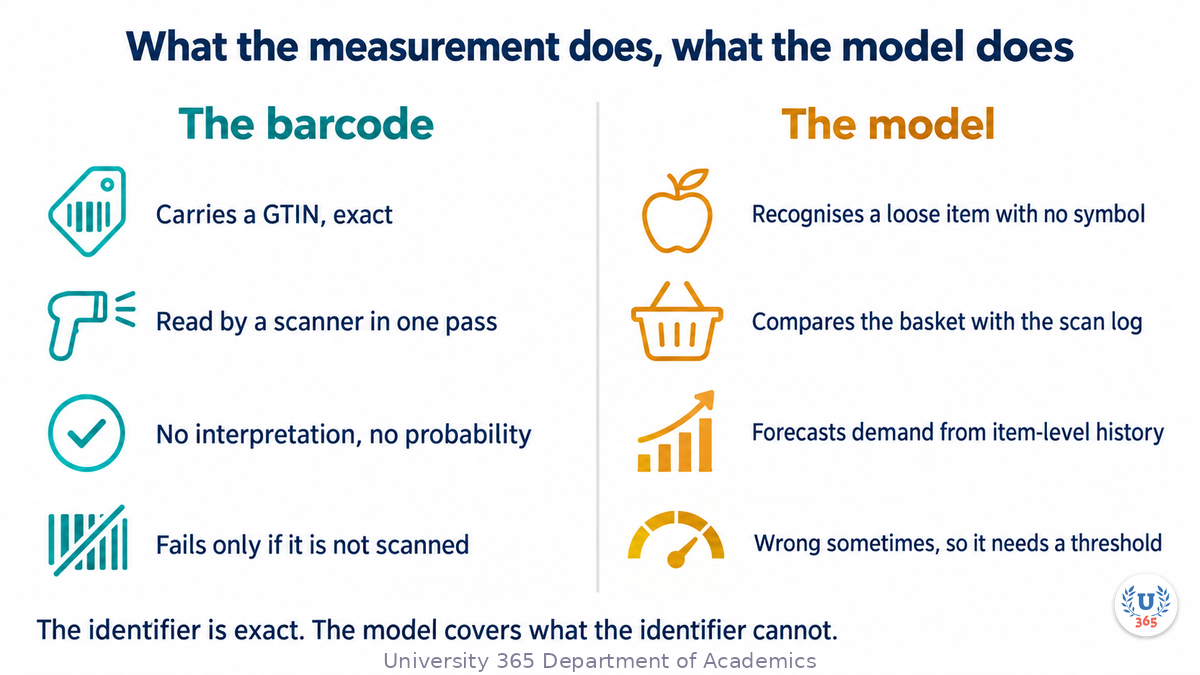
The scan itself needs no model. Turning 95 modules into twelve digits is deterministic decoding: the bar widths are measured, the parity of each character is checked, the check digit is recomputed. Nothing is guessed. The model appears where the identifier is missing or the scan never happened. Morrisons began rolling out Everseen's Evercheck across 200 stores in August 2026: an overhead camera compares the basket with what has been scanned, and shows a playback when it thinks an item was missed. Everseen says it runs at more than 150,000 checkouts in 10,000 stores. The gap also opens where no symbol exists: Mashgin's kiosks use multi-camera vision to ring up a whole tray, which is how a stadium sells a hot dog without a barcode.
The split is what matters. The barcode answers which product this is, with certainty and no probability. The model answers what is in this basket, or what will sell next week, with a probability that needs a threshold. The Grocer reported in August 2026 that an ECR Retail Loss study of 39 retailers found losses 33 per cent higher in stores with self-checkout, and that an on-screen prompt led shoppers to correct themselves in more than 80 per cent of cases. So when you read that a model improved checkout, ask which of the two jobs it did and what happens when it is wrong: a prompt to the shopper is a different product from an accusation.
The Story of the Barcode
The Five-Minute Version
A barcode writes a number in stripes so a machine can read it. Each digit is seven modules wide, made of two bars and two spaces, and the width pattern tells the scanner which half of the symbol it is reading and whether the symbol is upside down.
A UPC-A holds twelve digits between two guard patterns and a centre guard: 95 modules of symbol, 18 modules of quiet zone, 113 in total. At the target X-dimension of 0.330 millimetres the whole symbol is 37.29 millimetres wide and 22.85 millimetres high. Shrink it and the scanner, not the code, becomes the limit.
The twelfth digit is a checksum, not information. Multiply the odd positions by three, add the even positions, subtract from the next multiple of ten. For 0 3 6 0 0 0 2 9 1 4 5 the sum is 58, the next ten is 60, and the digit is 2. A misread fails the test and the scanner refuses.
The caveat is about credit. Emek Basker estimated a labour productivity gain of about 4.5 per cent in the first years of scanner use, and also concluded that the early scanners probably did not cover their cost. About a third of American supermarkets had one within a decade. The bars did not transform retail on contact.

The Story of the Barcode
Sources
All sources below were opened and read on 1 November 2026.
The first scan GS1, Marsh holds place of honor in history of GS1 barcode (26 June 2014)
The history of the code Smithsonian Magazine, The History of the Bar Code, adapted from Eureka by Gavin Weightman (2015, editor note 2017)
IBM and the UPC IBM, The UPC, corporate history (accessed 1 November 2026)
The standard GS1 General Specifications, Release 26.0, ratified January 2026
The 2027 target GS1, 2D Barcodes at Retail Point-of-Sale Implementation Guideline, version 1.1.0
The productivity estimate Basker, Raising the Barcode Scanner: Technology and Productivity in the Retail Sector, American Economic Journal: Applied Economics 4(3), July 2012
Item-level data in the chain GS1 US and Auburn University RFID Lab, EPC/RFID Retail Supply Chain Data Exchange Study, Project Zipper executive summary
Inventory accuracy Auburn University RFID Lab, Technology and Inventory Accuracy, white paper
AI at the self-checkout The Grocer, Morrisons rolling out self-checkout AI tech to detect mis-scans (6 August 2026)
Vision checkout without a barcode Mashgin, AI checkout compared with traditional self-checkout, FAQ (accessed 1 November 2026)




Comments